


Full Data for Best & Worst Cities to be a Real Estate Agent 2024
| CITY FINAL RANKING | City/State | CITY FINAL RANKING | City/State |
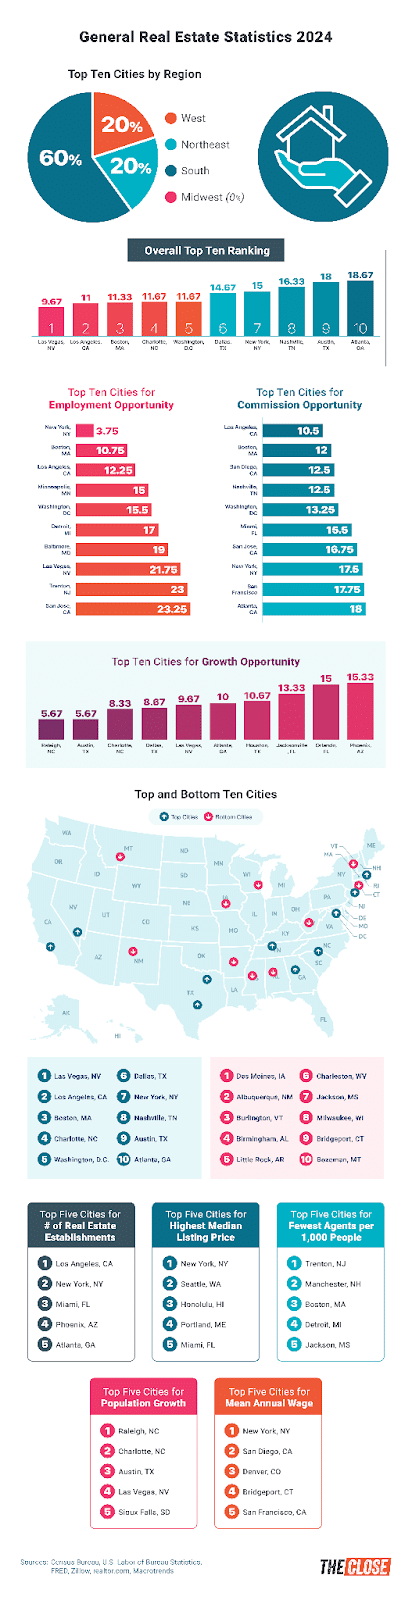
| 1 | Las Vegas, NV | 33 | Jacksonville, FL |
| 2 | Los Angeles, CA | 34 | Trenton, NJ |
| 3 | Boston, MA | 35 | Salt Lake City, UT |
| 4 | Charlotte, NC | 36 | Providence, RI |
| 5 | Washington, D.C. | 37 | St. Louis, MO |
| 6 | Dallas, TX | 38 | Detroit, MI |
| 7 | New York, NY | 39 | Boise City, ID |
| 8 | Nashville, TN | 40 | Sioux Falls, SD |
| 9 | Austin, TX | 41 | Portland, ME |
| 10 | Atlanta, GA | 42 | New Orleans, LA |
| 11 | San Diego, CA | 43 | Oklahoma City, OK |
| 12 | Seattle, WA | 44 | Kansas City, MO |
| 13 | Houston, TX | 45 | Dover, DE |
| 14 | Minneapolis, MN | 46 | Fargo, ND |
| 15 | San Bernardino, CA | 47 | Anchorage, AK |
| 16 | Philadelphia, PA | 48 | Wichita, KS |
| 17 | Phoenix, AZ | 49 | Omaha, NE |
| 18 | San Jose, CA | 50 | Honolulu, HI |
| 19 | Manchester, NH | 51 | Jackson, WY |
| 20 | Denver, CO | 52 | Louisville, KY |
| 21 | Chicago, IL | 53 | Norfolk, VA |
| 22 | Sacramento, CA | 54 | Colorado Springs, CO |
| 23 | Tampa, FL | 55 | Des Moines, IA |
| 24 | Miami, FL | 56 | Albuquerque, NM |
| 25 | Baltimore, MD | 57 | Burlington, VT |
| 26 | Raleigh, NC | 58 | Birmingham, AL |
| 27 | Portland, OR | 59 | Little Rock, AR |
| 28 | Orlando, FL | 60 | Charleston, WV |
| 29 | San Francisco, CA | 61 | Jackson, MS |
| 30 | Indianapolis, IN | 62 | Milwaukee, WI |
| 31 | Columbus, OH | 63 | Bridgeport, CT |
| 32 | Charleston, SC | 64 | Bozeman, MT |
Click here to return to article
Agent Employment Opportunity Ranking
| Number of Real Estate Establishments1 | Ranking | Annual Mean Wage2 | Ranking | Agent Employment per 1,0002 | Ranking | Location Quotient2 | Ranking | Agent Employment Opportunity Ranking | |
|---|---|---|---|---|---|---|---|---|---|
| New York, NY | 7161 | 2 | $97,780 | 1 | 0.657 | 6 | 0.5 | 6 | 1 |
| Boston, MA | 1169 | 28 | $79,730 | 9 | 0.419 | 3 | 0.32 | 3 | 2 |
| Los Angeles, CA | 9014 | 1 | $74,150 | 14 | 0.938 | 16 | 0.72 | 18 | 3 |
| Minneapolis, MN | 2646 | 14 | $72,290 | 20 | 0.846 | 13 | 0.65 | 13 | 4 |
| Washington DC | 2989 | 11 | $74,930 | 13 | 0.981 | 18 | 0.75 | 20 | 5 |
| Detroit, MI | 1076 | 33 | $65,200 | 27 | 0.458 | 4 | 0.35 | 4 | 6 |
| Baltimore, MD | 1166 | 29 | $67,590 | 25 | 0.835 | 11 | 0.64 | 11 | 7 |
| Las Vegas, NV | 1703 | 21 | $79,770 | 8 | 1.246 | 25 | 0.95 | 29 | 8 |
| Trenton, NJ | 95 | 62 | $68,470 | 23 | 0.307 | 1 | 0.24 | 1 | 9 |
| San Jose, CA | 1158 | 30 | $75,400 | 12 | 1.198 | 23 | 0.92 | 27 | 10 |
| Manchester, NH | 106 | 60 | $63,110 | 29 | 0.393 | 2 | 0.3 | 2 | 11 |
| Kansas City, MO | 1179 | 27 | $55,090 | 49 | 0.783 | 9 | 0.6 | 9 | 12 |
| Anchorage, AK | 208 | 55 | $72,390 | 19 | 0.837 | 12 | 0.64 | 12 | 13 |
| Chicago, IL | 4257 | 6 | $44,850 | 62 | 0.868 | 14 | 0.67 | 16 | 14 |
| Charlotte, NC | 2221 | 17 | $56,760 | 42 | 0.987 | 19 | 0.76 | 21 | 15 |
| San Diego, CA | 3032 | 10 | $86,630 | 2 | 1.894 | 44 | 1.45 | 46 | 16 |
| St. Louis, MO | 1090 | 32 | $48,280 | 57 | 0.744 | 7 | 0.57 | 7 | 17 |
| Philadelphia, PA | 1899 | 19 | $56,410 | 43 | 1.142 | 20 | 0.88 | 26 | 18 |
| Providence, RI | 538 | 43 | $73,800 | 15 | 1.342 | 28 | 0.76 | 23 | 19 |
| Seattle, WA | 3347 | 9 | $72,650 | 17 | 1.781 | 40 | 1.36 | 43 | 20 |
| Wichita, KS | 239 | 54 | $56,200 | 45 | 0.768 | 8 | 0.59 | 8 | 21 |
| Denver, CO | 3689 | 7 | $84,030 | 3 | 2.527 | 51 | 1.94 | 54 | 22 |
| Portland, OR | 1832 | 20 | $59,560 | 35 | 1.387 | 29 | 1.06 | 34 | 23 |
| New Orleans, LA | 454 | 46 | $51,990 | 53 | 0.826 | 10 | 0.63 | 10 | 24 |
| Dallas, TX | 3429 | 8 | $79,210 | 10 | 2.441 | 50 | 1.87 | 52 | 25 |
| Oklahoma City, OK | 698 | 39 | $72,840 | 16 | 1.68 | 37 | 0.95 | 30 | 26 |
| San Bernardino, CA | 1900 | 18 | $55,390 | 48 | 1.452 | 33 | 0.82 | 24 | 27 |
| Jackson, MS | 189 | 56 | $47,270 | 59 | 0.604 | 5 | 0.46 | 5 | 28 |
| Indianapolis, IN | 1263 | 26 | $67,840 | 24 | 1.599 | 36 | 1.23 | 41 | 29 |
| Austin, TX | 1647 | 22 | $82,170 | 6 | 2.262 | 48 | 1.73 | 51 | 30 |
| Burlington, VT | 99 | 61 | $75,460 | 11 | 1.486 | 34 | 0.84 | 25 | 31 |
| San Francisco, CA | 2931 | 12 | $82,930 | 5 | 3.366 | 61 | 1.91 | 53 | 32 |
| Columbus, OH | 863 | 37 | $44,280 | 63 | 0.96 | 17 | 0.74 | 19 | 33 |
| Nashville, TN | 594 | 42 | $39,550 | 64 | 0.898 | 15 | 0.69 | 17 | 34 |
| Salt Lake City, UT | 1353 | 24 | $56,080 | 46 | 1.419 | 31 | 1.09 | 37 | 35 |
| Houston, TX | 2445 | 16 | $80,830 | 7 | 3.06 | 59 | 2.34 | 60 | 36 |
| Sioux Falls, SD | 142 | 58 | $51,110 | 54 | 1.148 | 21 | 0.65 | 14 | 37 |
| Des Moines, IA | 433 | 47 | $71,740 | 21 | 1.892 | 43 | 1.07 | 36 | 38 |
| Bridgeport, CT | 330 | 50 | $83,850 | 4 | 2.436 | 49 | 1.38 | 44 | 39 |
| Atlanta, GA | 4419 | 5 | $58,250 | 36 | 2.657 | 54 | 2.04 | 56 | 40 |
| Dover, DE | 51 | 63 | $53,240 | 52 | 1.149 | 22 | 0.65 | 15 | 41 |
| Milwaukee, WI | 486 | 44 | $49,920 | 56 | 1.24 | 24 | 0.95 | 28 | 42 |
| Portland, ME | 460 | 45 | $57,990 | 38 | 1.776 | 39 | 1.01 | 32 | 43 |
| Sacramento, CA | 1395 | 23 | $66,960 | 26 | 2.796 | 56 | 1.58 | 50 | 44 |
| Little Rock, AR | 325 | 52 | $50,530 | 55 | 1.338 | 27 | 0.76 | 22 | 45 |
| Fargo, ND | 167 | 57 | $60,490 | 34 | 1.402 | 30 | 1.07 | 35 | 46 |
| Louisville, KY | 658 | 41 | $46,400 | 60 | 1.287 | 26 | 0.99 | 31 | 47 |
| Phoenix, AZ | 4723 | 4 | $60,720 | 33 | 3.245 | 60 | 2.49 | 61 | 48 |
| Raleigh, NC | 1144 | 31 | $57,420 | 39 | 1.959 | 45 | 1.5 | 48 | 49 |
| Norfolk, VA | 963 | 35 | $70,310 | 22 | 2.598 | 52 | 1.99 | 55 | 50 |
| Tampa, FL | 2727 | 13 | $58,120 | 37 | 2.814 | 57 | 2.16 | 58 | 51 |
| Omaha, NE | 682 | 40 | $61,880 | 30 | 2.022 | 47 | 1.55 | 49 | 52 |
| Jacksonville, FL | 1327 | 25 | $61,090 | 31 | 2.706 | 55 | 2.07 | 57 | 53 |
| Jackson, WY | 140 | 59 | $56,380 | 44 | 1.439 | 32 | 1.1 | 38 | 54 |
| Honolulu, HI | 328 | 51 | $55,630 | 47 | 1.564 | 35 | 1.2 | 40 | 55 |
| Birmingham, AL | 420 | 48 | $57,180 | 41 | 1.813 | 41 | 1.39 | 45 | 56 |
| Colorado Springs, CO | 1045 | 34 | $72,470 | 18 | 3.993 | 63 | 3.06 | 63 | 57 |
| Charleston, WV | 34 | 64 | $57,370 | 40 | 1.845 | 42 | 1.04 | 33 | 58 |
| Bozeman, MT | 276 | 53 | $64,620 | 28 | 2.603 | 53 | 1.47 | 47 | 59 |
| Miami, FL | 6467 | 3 | $54,480 | 50 | 4.218 | 64 | 3.23 | 64 | 60 |
| Boise City, ID | 906 | 36 | $45,340 | 61 | 1.959 | 46 | 1.11 | 39 | 61 |
| Albuquerque, NM | 382 | 49 | $47,280 | 58 | 1.738 | 38 | 1.33 | 42 | 62 |
| Charleston, SC | 775 | 38 | $60,880 | 32 | 3.05 | 58 | 2.34 | 59 | 63 |
| Orlando, FL | 2560 | 15 | $54,300 | 51 | 3.912 | 62 | 3 | 62 | 64 |
| 1Census Bureau 2US Bureau of Labor Statistics |
|||||||||
Advertisement
Click here to return to article
Agent Commission Opportunity Ranking
| City/State | Median Listing Home Price1 | Ranking | Available Inventory2 | Ranking | Median Monthly Rent3 | Ranking | Median Days on Market2 | Ranking | Agent Commission Opportunity Ranking |
|---|---|---|---|---|---|---|---|---|---|
| Los Angeles, CA | $1,200,000 | 3 | 10044 | 9 | $2,780 | 8 | 54 | 22 | 1 |
| Boston, MA | $999,000 | 5 | 4,407 | 24 | $3,500 | 2 | 53 | 17 | 2 |
| San Diego, CA | $939,100 | 6 | 2619 | 35 | $2,995 | 6 | 44 | 3 | 3 |
| Nashville, TN | $575,000 | 16 | 6970 | 15 | $2,145 | 15 | 44 | 4 | 4 |
| Washington DC | $615,000 | 15 | 6814 | 16 | $2,500 | 10 | 50 | 12 | 5 |
| Miami, FL | $699,000 | 12 | 30835 | 1 | $3,200 | 5 | 61 | 44 | 6 |
| San Jose, CA | $1,100,000 | 4 | 833 | 55 | $2,965 | 7 | 43 | 1 | 7 |
| New York, NY | $799,000 | 8 | 28830 | 2 | $3,400 | 3 | 71 | 57 | 8 |
| San Francisco, CA | $1,395,000 | 2 | 3094 | 33 | $3,300 | 4 | 58 | 32 | 9 |
| Atlanta, GA | $410,000 | 31 | 16442 | 5 | $2,064 | 18 | 53 | 18 | 10 |
| Phoenix, AZ | $489,900 | 22 | 11355 | 8 | $1,950 | 24 | 53 | 19 | 11 |
| Tampa, FL | $459,900 | 26 | 12399 | 7 | $2,186 | 13 | 57 | 28 | 12 |
| Seattle, WA | $779,900 | 9 | 4177 | 26 | $2,063 | 19 | 57 | 29 | 13 |
| Chicago, IL | $344,900 | 38 | 13067 | 6 | $1,960 | 22 | 51 | 15 | 14 |
| Dallas, TX | $439,000 | 28 | 17347 | 4 | $1,915 | 27 | 58 | 34 | 15 |
| Las Vegas, NV | $435,000 | 29 | 5202 | 19 | $1,950 | 25 | 54 | 23 | 16 |
| Charlotte, NC | $415,000 | 30 | 5014 | 20 | $1,941 | 26 | 53 | 20 | 17 |
| Sacramento, CA | $460,000 | 24 | 2585 | 36 | $1,995 | 21 | 52 | 16 | 18 |
| Orlando, FL | $385,000 | 35 | 8605 | 11 | $2,056 | 20 | 58 | 33 | 19 |
| Houston, TX | $335,000 | 40 | 21529 | 3 | $1,800 | 30 | 56 | 25 | 20 |
| Denver, CO | $499,000 | 21 | 4947 | 21 | $2,100 | 16 | 61 | 45 | 21 |
| Austin, TX | $630,000 | 14 | 7319 | 14 | $2,150 | 14 | 74 | 60 | 22 |
| Providence, RI | $390,000 | 33 | 1585 | 48 | $2,100 | 17 | 45 | 6 | 23 |
| Charleston, SC | $674,900 | 13 | 2442 | 38 | $1,955 | 23 | 57 | 30 | 24 |
| Honolulu, HI | $762,500 | 10 | 2107 | 43 | $2,700 | 9 | 62 | 48 | 25 |
| San Bernardino, CA | $459,900 | 25 | 8337 | 12 | $1,750 | 35 | 59 | 42 | 26 |
| Portland, ME | $710,000 | 11 | 859 | 54 | $2,500 | 11 | 59 | 39 | 27 |
| Manchester, NH | $409,000 | 32 | 274 | 62 | $1,800 | 31 | 43 | 2 | 28 |
| Norfolk, VA | $312,300 | 45 | 3463 | 31 | $1,495 | 46 | 45 | 7 | 29 |
| Philadelphia, PA | $254,000 | 52 | 8879 | 10 | $1,600 | 41 | 56 | 26 | 30 |
| Minneapolis, MN | $309,000 | 46 | 5736 | 18 | $1,495 | 45 | 55 | 24 | 31 |
| Jackson, WY | $2,800,000 | 1 | 253 | 63 | $10,000 | 1 | 106 | 64 | 32 |
| Portland, OR | $527,500 | 19 | 4897 | 22 | $1,695 | 38 | 66 | 54 | 33 |
| Raleigh, NC | $475,000 | 23 | 2974 | 34 | $1,850 | 28 | 63 | 49 | 34 |
| Boise City, ID | $568,000 | 18 | 1888 | 45 | $1,795 | 33 | 59 | 41 | 35 |
| Baltimore, MD | $189,900 | 58 | 3864 | 28 | $1,500 | 43 | 46 | 10 | 36 |
| Omaha, NE | $335,000 | 41 | 2011 | 44 | $1,300 | 52 | 45 | 8 | 37 |
| Colorado Springs, CO | $450,000 | 27 | 1813 | 46 | $1,796 | 32 | 59 | 40 | 38 |
| Bozeman, MT | $850,000 | 7 | 522 | 58 | $2,300 | 12 | 94 | 63 | 39 |
| Detroit, MI | $85,000 | 64 | 7356 | 13 | $1,195 | 56 | 50 | 14 | 40 |
| Jacksonville, FL | $308,900 | 47 | 5951 | 17 | $1,623 | 40 | 61 | 46 | 41 |
| Columbus, OH | $275,000 | 50 | 2441 | 39 | $1,413 | 48 | 49 | 11 | 42 |
| Salt Lake City, UT | $569,900 | 17 | 2223 | 42 | $1,515 | 42 | 63 | 50 | 43 |
| Louisville, KY | $250,000 | 54 | 2483 | 37 | $1,250 | 53 | 50 | 13 | 44 |
| Trenton, NJ | $222,500 | 57 | 324 | 60 | $1,775 | 34 | 46 | 9 | 45 |
| St. Louis, MO | $136,000 | 62 | 4650 | 23 | $1,200 | 55 | 53 | 21 | 46 |
| Oklahoma City, OK | $299,900 | 48 | 4015 | 27 | $1,300 | 51 | 58 | 36 | 47 |
| Milwaukee, WI | $170,000 | 61 | 2360 | 41 | $1,250 | 54 | 44 | 5 | 48 |
| Indianapolis, IN | $250,000 | 53 | 3695 | 29 | $1,325 | 49 | 57 | 31 | 49 |
| New Orleans, LA | $350,000 | 37 | 3506 | 30 | $1,750 | 36 | 78 | 62 | 50 |
| Burlington, VT | $509,700 | 20 | 229 | 64 | $1,825 | 29 | 67 | 55 | 51 |
| Dover, DE | $324,900 | 43 | 385 | 59 | $1,650 | 39 | 58 | 35 | 52 |
| Little Rock, AR | $280,000 | 49 | 1756 | 47 | $1,195 | 57 | 56 | 27 | 53 |
| Bridgeport, CT | $369,900 | 36 | 1039 | 52 | $1,450 | 47 | 61 | 47 | 54 |
| Kansas City, MO | $229,000 | 55 | 4380 | 25 | $1,300 | 50 | 64 | 52 | 55 |
| Albuquerque, NM | $335,000 | 42 | 1376 | 50 | $1,500 | 44 | 64 | 51 | 56 |
| Anchorage, AK | $387,450 | 34 | 618 | 57 | $1,727 | 37 | 74 | 61 | 57 |
| Sioux Falls, SD | $319,000 | 44 | 931 | 53 | $1,133 | 59 | 58 | 38 | 58 |
| Wichita, KS | $273,900 | 51 | 1162 | 51 | $1,195 | 58 | 58 | 37 | 59 |
| Birmingham, AL | $183,000 | 59 | 3175 | 32 | $1,099 | 60 | 60 | 43 | 60 |
| Des Moines, IA | $229,000 | 56 | 2414 | 40 | $1,095 | 61 | 71 | 58 | 61 |
| Jackson, MS | $107,000 | 63 | 1494 | 49 | $1,085 | 62 | 70 | 56 | 62 |
| Fargo, ND | $335,650 | 39 | 734 | 56 | $1,000 | 63 | 72 | 59 | 63 |
| Charleston, WV | $173,800 | 60 | 296 | 61 | $995 | 64 | 64 | 53 | 64 |
| 1Realtor.com 2FRED 3Zillow |
|||||||||
Click here to return to article
Location Growth Opportunity Ranking
| City/State | Percentage of Population Growth Rate (2023 to 2024)1 | Ranking | Percentage of Job Growth2 | Ranking | New Residential Construction Permits3 | Ranking | Location Growth Opportunity Ranking |
|---|---|---|---|---|---|---|---|
| Raleigh, NC | 2.39% | 1 | 3.80% | 1 | 20619 | 15 | 1 |
| Austin, TX | 2.06% | 3 | 2.80% | 9 | 38599 | 5 | 2 |
| Charlotte, NC | 2.38% | 2 | 2.50% | 15 | 29361 | 8 | 3 |
| Dallas, TX | 1.23% | 20 | 3.30% | 4 | 66557 | 2 | 4 |
| Las Vegas, NV | 1.86% | 4 | 3.80% | 3 | 13073 | 22 | 5 |
| Atlanta, GA | 1.42% | 10 | 2.50% | 14 | 38589 | 6 | 6 |
| Houston, TX | 1.42% | 11 | 2.30% | 20 | 68336 | 1 | 7 |
| Jacksonville, FL | 1.22% | 22 | 3.80% | 2 | 20253 | 16 | 8 |
| Orlando, FL | 1.45% | 8 | 1.90% | 28 | 25774 | 9 | 9 |
| Phoenix, AZ | 1.27% | 16 | 1.90% | 27 | 45637 | 3 | 10 |
| Nashville, TN | 1.37% | 13 | 2.10% | 23 | 23903 | 11 | 11 |
| Charleston, SC | 1.48% | 6 | 2.60% | 12 | 8496 | 31 | 12 |
| Boise City, ID | 1.28% | 15 | 3.00% | 6 | 9882 | 29 | 13 |
| Sioux Falls, SD | 1.70% | 5 | 3.00% | 7 | 3448 | 44 | 14 |
| San Bernardino, CA | 1.39% | 12 | 1.80% | 30 | 19710 | 17 | 15 |
| Miami, FL | 0.83% | 43 | 3.00% | 5 | 21329 | 13 | 16 |
| Indianapolis, IN | 1.17% | 23 | 2.40% | 16 | 12588 | 23 | 17 |
| Sacramento, CA | 1.26% | 17 | 2.20% | 21 | 11917 | 24 | 18 |
| Tampa, FL | 1.07% | 29 | 1.90% | 29 | 25395 | 10 | 19 |
| Philadelphia, PA | 0.62% | 51 | 2.70% | 11 | 13476 | 21 | 20 |
| Fargo, ND | 1.45% | 9 | 2.20% | 22 | 2106 | 52 | 21 |
| Charleston, WV | 1.48% | 7 | 2.60% | 13 | 188 | 64 | 22 |
| Albuquerque, NM | 1.26% | 18 | 2.40% | 19 | 2977 | 47 | 23 |
| Columbus, OH | 1.11% | 27 | 1.80% | 31 | 11439 | 26 | 24 |
| Washington DC | 1.00% | 32 | 1.40% | 40 | 23034 | 12 | 25 |
| Seattle, WA | 0.85% | 42 | 2.00% | 24 | 17254 | 19 | 26 |
| Birmingham, AL | 0.93% | 35 | 3.00% | 8 | 3287 | 45 | 27 |
| Salt Lake City, UT | 0.91% | 36 | 2.00% | 25 | 9199 | 30 | 28 |
| Los Angeles, CA | 0.51% | 58 | 1.70% | 33 | 30691 | 7 | 29 |
| Boston, MA | 0.53% | 57 | 2.40% | 17 | 10580 | 28 | 30 |
| Minneapolis, MN | 0.80% | 46 | 1.50% | 38 | 17943 | 18 | 31 |
| Portland, OR | 1.04% | 31 | 1.20% | 46 | 11294 | 27 | 32 |
| Denver, CO | 1.09% | 28 | -0.40% | 62 | 20623 | 14 | 33 |
| Manchester, NH | 1.32% | 14 | 1.70% | 35 | 1382 | 56 | 34 |
| Dover, DE | 1.22% | 21 | 2.00% | 26 | 1105 | 59 | 35 |
| New York, NY | 0.51% | 59 | 1.20% | 45 | 39941 | 4 | 36 |
| New Orleans, LA | 0.79% | 47 | 2.40% | 18 | 3101 | 46 | 37 |
| San Diego, CA | 0.78% | 48 | 1.40% | 41 | 11468 | 25 | 38 |
| Baltimore, MD | 0.64% | 50 | 1.80% | 32 | 7236 | 35 | 39 |
| Portland, ME | 1.04% | 30 | 1.50% | 39 | 2972 | 48 | 40 |
| Oklahoma City, OK | 0.88% | 39 | 1.40% | 42 | 6458 | 37 | 41 |
| Des Moines, IA | 1.24% | 19 | 0.60% | 58 | 5017 | 42 | 42 |
| Colorado Springs, CO | 1.15% | 24 | 0.80% | 55 | 5291 | 41 | 43 |
| St. Louis, MO | 0.54% | 55 | 1.70% | 34 | 7300 | 34 | 44 |
| Little Rock, AR | 1.13% | 26 | 1.10% | 48 | 2655 | 50 | 45 |
| Omaha, NE | 0.93% | 33 | 1.00% | 50 | 4705 | 43 | 46 |
| Louisville, KY | 0.90% | 37 | 0.90% | 53 | 6810 | 36 | 47 |
| Chicago, IL | 0.53% | 56 | 0.90% | 52 | 14821 | 20 | 48 |
| Kansas City, MO | 0.81% | 45 | 0.80% | 54 | 7473 | 33 | 49 |
| Jackson, WY | 0.42% | 61 | 2.80% | 10 | 284 | 63 | 50 |
| Trenton, NJ | 0.89% | 38 | 1.60% | 36 | 978 | 60 | 51 |
| San Jose, CA | 0.71% | 49 | 1.00% | 49 | 6288 | 38 | 52 |
| San Francisco, CA | 0.45% | 60 | 1.10% | 47 | 7478 | 32 | 53 |
| Wichita, KS | 0.93% | 34 | 0.80% | 56 | 2676 | 49 | 54 |
| Bozeman, MT | 0.88% | 41 | 1.60% | 37 | 351 | 62 | 55 |
| Honolulu, HI | 0.88% | 40 | 0.93% | 51 | 1851 | 54 | 56 |
| Jackson, MS | 1.15% | 25 | -0.70% | 64 | 1220 | 57 | 57 |
| Bridgeport, CT | 0.62% | 52 | 1.40% | 43 | 1506 | 55 | 58 |
| Norfolk, VA | 0.54% | 54 | 0.60% | 57 | 6114 | 40 | 59 |
| Burlington, VT | 0.83% | 44 | 0.50% | 59 | 1187 | 58 | 60 |
| Milwaukee, WI | 0.55% | 53 | 0.40% | 60 | 2517 | 51 | 61 |
| Detroit, MI | 0.20% | 63 | -0.40% | 63 | 6197 | 39 | 62 |
| Anchorage, AK | 0.02% | 64 | 1.40% | 44 | 373 | 61 | 63 |
| Providence, RI | 0.41% | 62 | 0.40% | 61 | 1909 | 53 | 64 |
| 1Macrotrends 2US Bureau of Labor Statistics 3FRED |
|||||||
Advertisement
Click here to return to article