


Check out the newest real estate agent statistics, insights, and trends! Staying up-to-date with real estate statistics is crucial for agents. It helps them grasp market trends, spot opportunities, and ensure their clients have realistic expectations. Plus, keeping abreast of real estate stats enables agents to showcase their expertise, build trust, and attract more business.

Home Buying Statistics
Why These Stats Matter
The changing work patterns in America have influenced how people buy homes. With the freedom to live and work from anywhere, homebuyers are exploring more options and prioritizing their preferences over proximity to work. However, higher home prices and mortgage rates have slowed the home-buying process for many, prompting a more cautious approach to homeownership. Nonetheless, move-up buyers and investors continue to purchase homes steadily, intensifying the pressure on the limited housing supply.
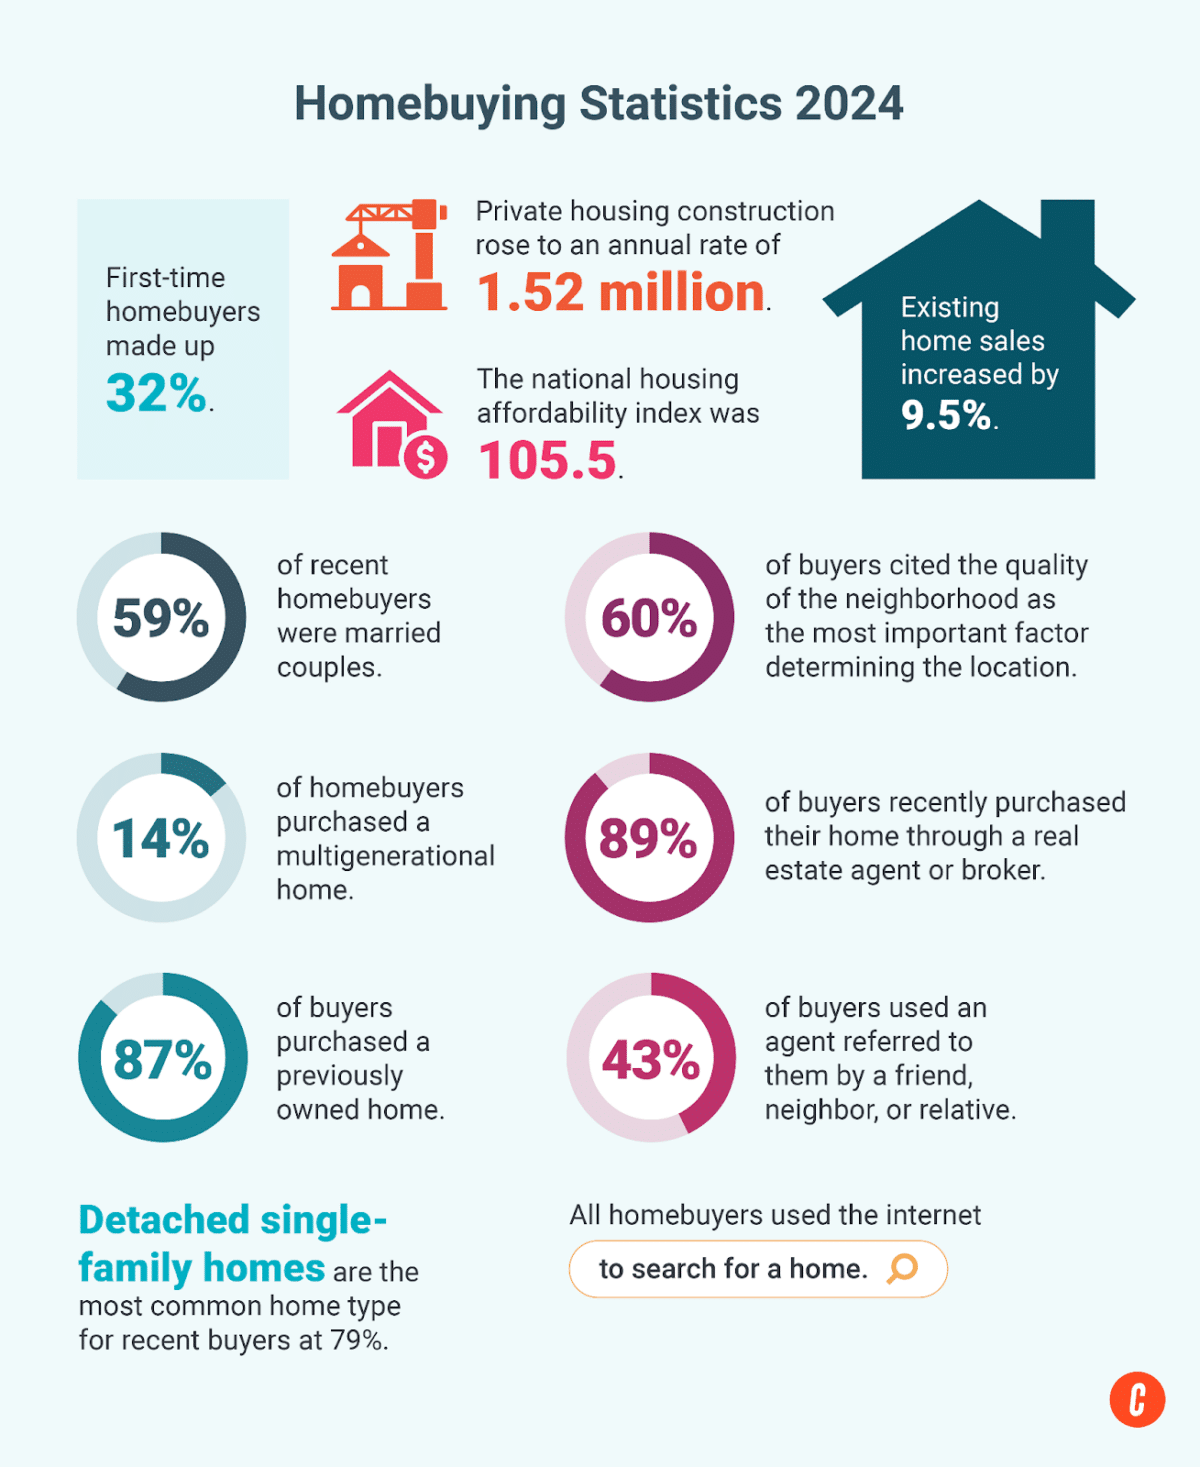
1. In February 2024, existing home sales increased by 9.5% to a seasonally adjusted annual rate of 4.4 million. This event marks the most significant monthly increase since February 2023.[1]
2. The Pending Home Sales Index (PHSI) increased to 75.6 in February 2024 by 1.6% compared with that in the previous month.[1]
3. In February 2024, new listings experienced a year-over-year (YoY) increase of 14.8%, compared with 8.2% in the prior month. This milestone marks the most significant annual gain in listings since May 2021.[1]
4. In January 2024, the national housing affordability index was 105.5. This statistic is an improvement from the previous month but still lower than the index of 109.2 from a year ago. This fact means a family with a median income has more than enough to afford a median-priced home.[1]
5. In February 2024, private housing construction rose to an annual rate of 1.52 million, up 10.7% from January 2024 and 5.9% from February 2023, indicating potential continued growth in the housing market.[1]
6. The share of home buyers by generation is as follows[2]:
- Gen Z: 3%
- Younger Gen Y/millennials: 17%
- Older Gen Y/millennials: 21%
- Gen Xers: 24%
- Younger boomers: 19%
- Older boomers: 12%
- Silent generation: 4%
7. First-time home buyers made up 32%, up from last year’s 26%.[3]
8. 59% of recent home buyers were married couples, 19% were single females, 10% were single males, and 9% were unmarried couples.[3]
9. 14% of home buyers purchased a multigenerational home, the most common reasons being to care for aging parents, for cost savings, or because children or relatives over the age 18 were moving back home.[3]
10. At 26%, the primary reason for purchasing a home was the desire to own one. For first-time buyers, this number jumps to 60%.[3]
11. 13% of home buyers purchased a new home, and 87% of buyers purchased a previously owned home.[3]
12. Detached single-family homes remained the most common home type for recent buyers at 79%, followed by townhouses or row houses at 8%.[3]
13. For home buyers, 60% cited the quality of the neighborhood as the most critical factor determining the location. Convenience to friends and family and overall affordability of homes were recorded at 45% and 39%, respectively.[3]
14. 41% of recent buyers began taking the home-buying process seriously by looking at properties for sale online, while 20% first contacted a real estate agent.[3]
15. 90% of recent buyers found their real estate agent either a “very” or “somewhat” helpful information source.[3]
16. All home buyers used the Internet to search for a home. The most valuable contents on websites were photos, detailed information about properties for sale, floor plans, and the real estate agent’s contact information.[3]
17. 89% of buyers recently purchased their home through a real estate agent or broker, and 6% purchased directly through the previous owner.[3]
18. 43% of buyers used an agent referred to them by a friend, neighbor, or relative; 13% used an agent that they had worked with in the past to buy or sell a home; 7% found their agent when inquiring about a specific property found online; and 7% saw their agent through a website without a specific reference.[3]
19. For first-time home buyers, 38% said saving for a down payment was the most challenging step in the process.[3]
20. For 54% of buyers, the source of the down payment came from their savings.[3]
Home Selling Statistics
Why These Stats Matter
Selling real estate agent stats for homes is essential for buyers and sellers to understand market trends and make informed decisions. For sellers, these real estate agent facts help in pricing their homes effectively and gauging buyer interest. In contrast, buyers can use them to assess market competitiveness and pricing trends and negotiate better deals.
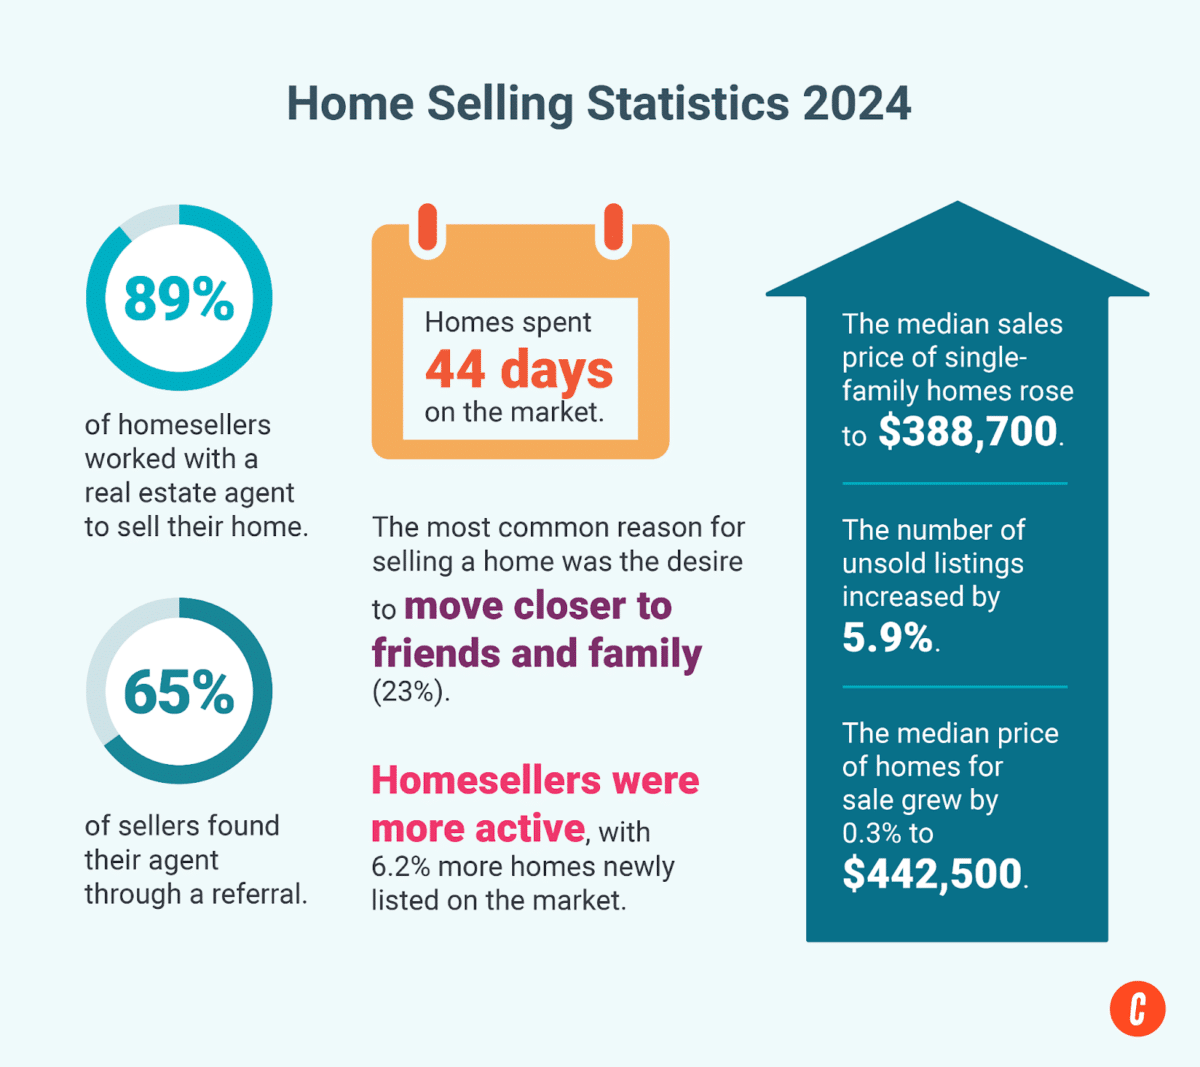
21. The median sales price of single-family homes rose to $388,700 in February 2024, exceeding the previous year’s median of $368,100.[1]
22. In February 2024, the number of unsold listings increased by 5.9% compared with last month’s and by 10.3% compared with last year’s.[1]
23. The share of home sellers by generation is the following[2]:
- Gen Z: 2%
- Younger Gen Y/millennials: 6%
- Older Gen Y/millennials: 17%
- Gen Xers: 23%
- Younger boomers: 26%
- Older boomers: 19%
- Silent generation: 6%
24. For all sellers, the most commonly cited reason for selling their home was the desire to move closer to friends and family (23%), because the home is too small (13%), or a change in the family situation such as a marriage, divorce, or new child (10%).[3]
25. 89% of home sellers worked with a real estate agent to sell their home; 7% sold via FSBO; and less than 1% sold via iBuyer.[3]
26. For recently sold homes, the final sales price was a median of 100% of the final listing price, maintaining last year’s highest recorded since 2002.[3]
27. In May 2024, homes spent 44 days on the market, one day more than last year but eight days shorter than before the COVID-19 pandemic.[4]
28. 65% of sellers found their agent through a referral from a friend, neighbor, or relative or used an agent they had worked with to buy or sell a home.[3]
29. In 2023, 7% of recent home sales were FSBO sales, an all-time low that matches the share seen in the 2021 report.[3]
30. Within rural areas, 14% sold via FSBO compared with 3% of sellers in urban areas.[3]
31. FSBOs typically sell for less than the selling price of other homes; last year, FSBO homes sold for a median of $310,000, significantly lower than the median of agent-assisted homes, which was $405,000.[3]
32. In May 2024, the median price of homes for sale remained relatively stable compared with last year, growing by 0.3% to $442,500. However, the median price per square foot rose by 3.8%, indicating that the inventory of smaller and more affordable homes has grown in share.[4]
33. Home sellers were more active this May 2024, with 6.2% more homes newly listed on the market than last year.[4]
Today’s Market Shifts
Why These Stats Matter
Given the current economic fluctuations, the real estate market faces significant, multifaceted changes. Real estate agents provide valuable insights and guidance to help clients make astute decisions aligned with their needs. They offer expertise in navigating the complexities of the real estate market and provide support throughout the transaction process.
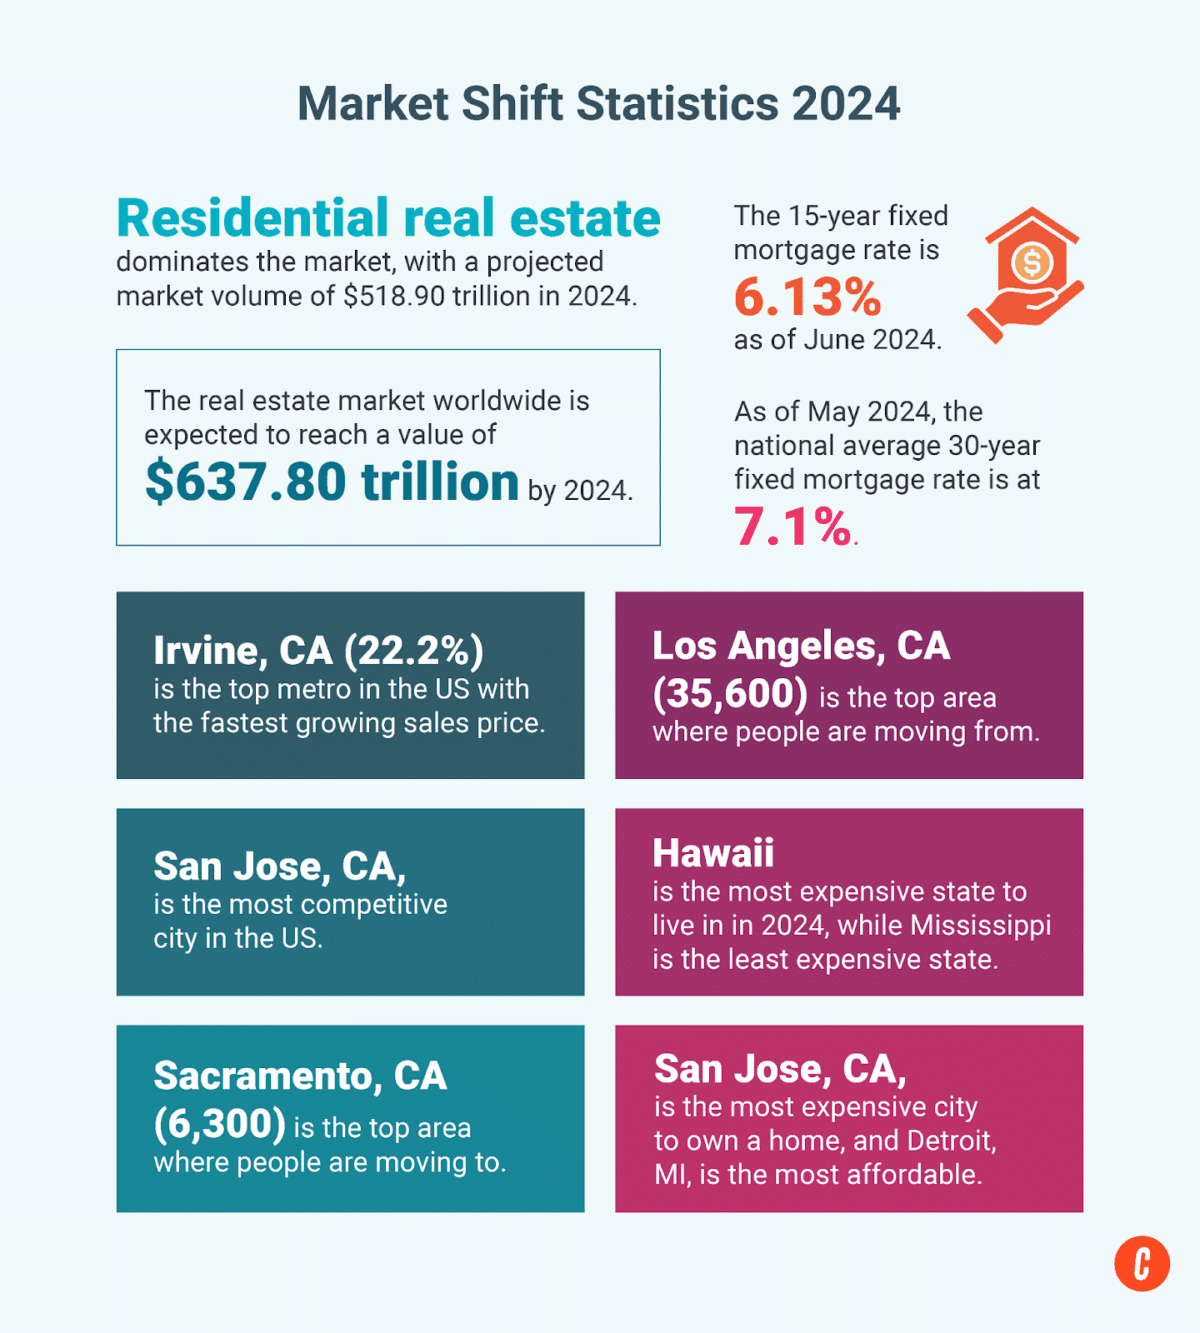
34. The real estate market worldwide is expected to reach a staggering value of $637.80 trillion by 2024.[5]
35. Among the various segments, residential real estate dominates the market, with a projected market volume of $518.90 trillion in 2024.[5]
36. The 15-year fixed mortgage rate is 6.13% as of June 19, 2024.[6]
37. As of May 2024, the national average 30-year fixed mortgage rate is at 7.1%, increased by 0.6 points YoY. [7]
38. Top five metros in the US with the fastest growing sales price[7]:
- 22.2%—Irvine, CA
- 21.6%—Long Beach, CA
- 20.7%—Dallas, TX
- 20.0%—West Palm Beach, FL
- 19.8%—Paradise, NV
39. Top five most competitive cities in the US[7]:
- San Jose, CA
- Cary, NC
- Sacramento, CA
- Littleton, CO
- Richmond, VA
40. Top five areas where people are moving to (net inflow from March 2024 to May 2024)[7]:
- 6,300—Sacramento, CA
- 5,600—Phoenix, AZ
- 5,400—Sarasota, FL
- 5,100—Cape Coral, FL
- 5,000—Las Vegas, NV
41. Top five areas where people are moving from (net inflow from March 2024 to May 2024)[7]:
- 35,600—Los Angeles, CA
- 32,200—New York, NY
- 25,800—San Francisco, CA
- 20,100—Seattle, WA
- 15,100—Washington, D.C.
42. Most expensive states to live in 2024[8]:
- Hawaii
- District of Columbia
- Massachusetts
- California
- New York
43. Least expensive states to live in 2024[8]:
- Mississippi
- Oklahoma
- Kansas
- Missouri
- Alabama
44. Most expensive cities to own a home[9]:
- San Jose, CA
- San Diego, CA
- New York City, NY
- Washington, D.C.
- San Francisco, CA
45. The most affordable cities to own a home[10]:
- Detroit, Michigan
- Cleveland, Ohio
- Toledo, Ohio
- Memphis, Tennessee
- Baltimore, Maryland
Rental Statistics
Why These Stats Matter
Both landlords and tenants need to have rental real estate agent statistics. These numbers show rental real estate trends. Landlords can use them to set competitive rental prices and understand vacancy rates. They can also make better decisions about property investments. Rental statistics offer insights into average rental prices for tenants in specific areas. This data helps them make informed decisions when looking for a new place to live.
46. Top five states with the highest average monthly rental costs[11]:
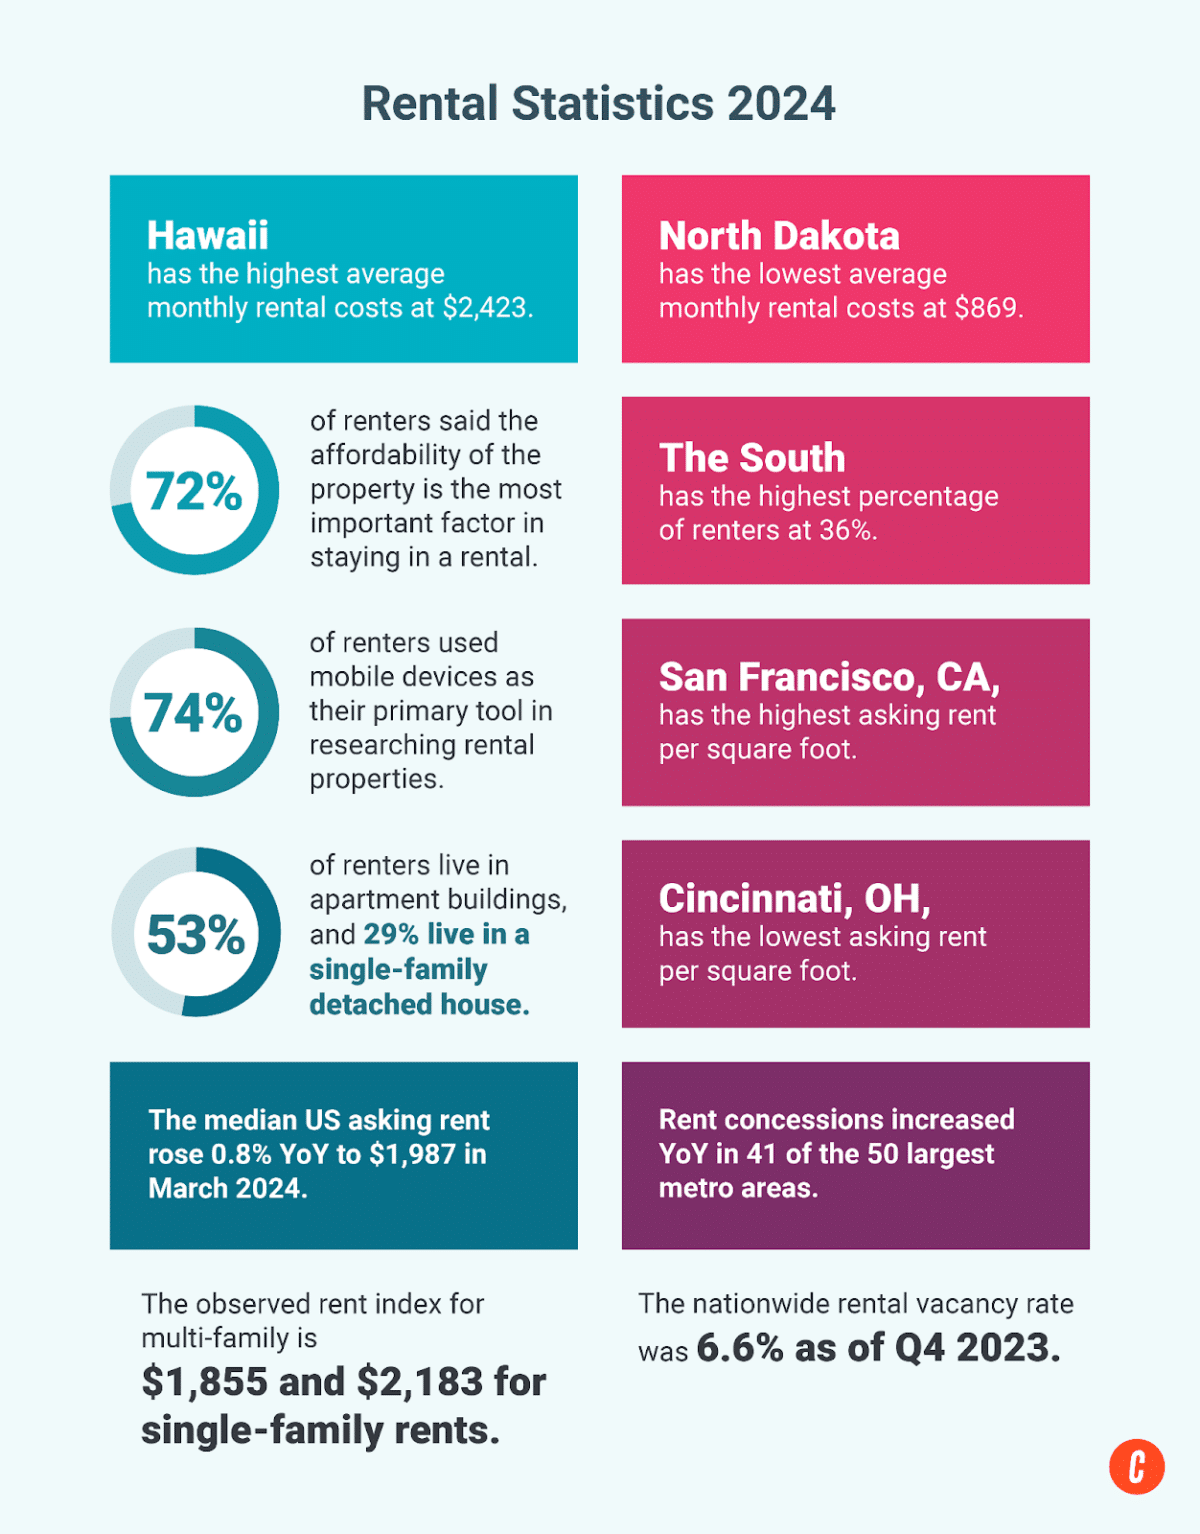
- $2,423—Hawaii
- $1,956—California
- $1,828—New Jersey
- $1,806—Massachusetts
- $1,745—New York
47. Top five states with the lowest average monthly rental costs[11]:
- $869—North Dakota
- $972—Iowa
- $973—South Dakota
- $988—Kentucky
- $1,008—Arkansas
48. 72% of renters said the affordability of the property is the most important factor in staying in a rental.[12]
49. As of March 2024, the observed rent index for multi-family is $1,855 and $2,183 for single-family rents.[13]
50. Pittsburgh stood out as the sole area to see a decrease in typical rents (-0.2%) from February to March. In contrast, Washington, D.C., the New York City metro area, and San Jose each recorded significant 1% increases in typical rents on a month-to-month basis.[13]
51. Rent concessions increased YoY in 41 of the 50 largest metro areas. The annual increase in the share of rental listings with concessions was highest in Charlotte (18.3ppts), Raleigh (18.3ppts), Austin (15.5ppts), Jacksonville (14.5ppts), and Salt Lake City (14.3ppts).[13]
52. The nationwide rental vacancy rate was 6.6% as of Q4 2023.[13]
53. 74% of renters used mobile devices as their primary tool in researching rental properties.[12]
54. 53% of renters live in apartment buildings, and 29% of renters live in a single-family detached house.[12]
55. The South has the highest percentage of renters at 36%, followed by the West (28%), the Northeast (19%), and the Midwest (18%).[12]
56. Top five cities with the highest asking rent per square foot[14]:
- $4/sq. ft.—San Francisco, CA
- $3.92/sq. ft.—New York, NY
- $3.34/sq. ft.—San Jose, CA
- $3.12/sq. ft.—Boston, MA
- $2.86/sq. ft.—San Diego, CA
57. Top five cities with the lowest asking rent per square foot[14]:
- $1.36/sq. ft.—Cincinnati, OH
- $1.35/sq. ft.—Columbus, OH
- $1.34/sq. ft.—Kansas City, MO
- $1.34/sq. ft.—Detroit, MI
- $1.34/sq. ft.—St. Louis, MO
58. The median US asking rent rose 0.8% YoY to $1,987 in March 2024, marking the third consecutive increase after three months of decreases.[15]
Commercial Real Estate Statistics
Why These Stats Matter
Commercial real estate broker statistics are essential for understanding market trends, making informed investment decisions, and evaluating the economy’s overall health. They offer valuable insights into vacancy rates, rental prices, sales volume, and other key indicators. By analyzing and interpreting these statistics, stakeholders can better understand current conditions and anticipate future trends, enabling them to make more informed choices.
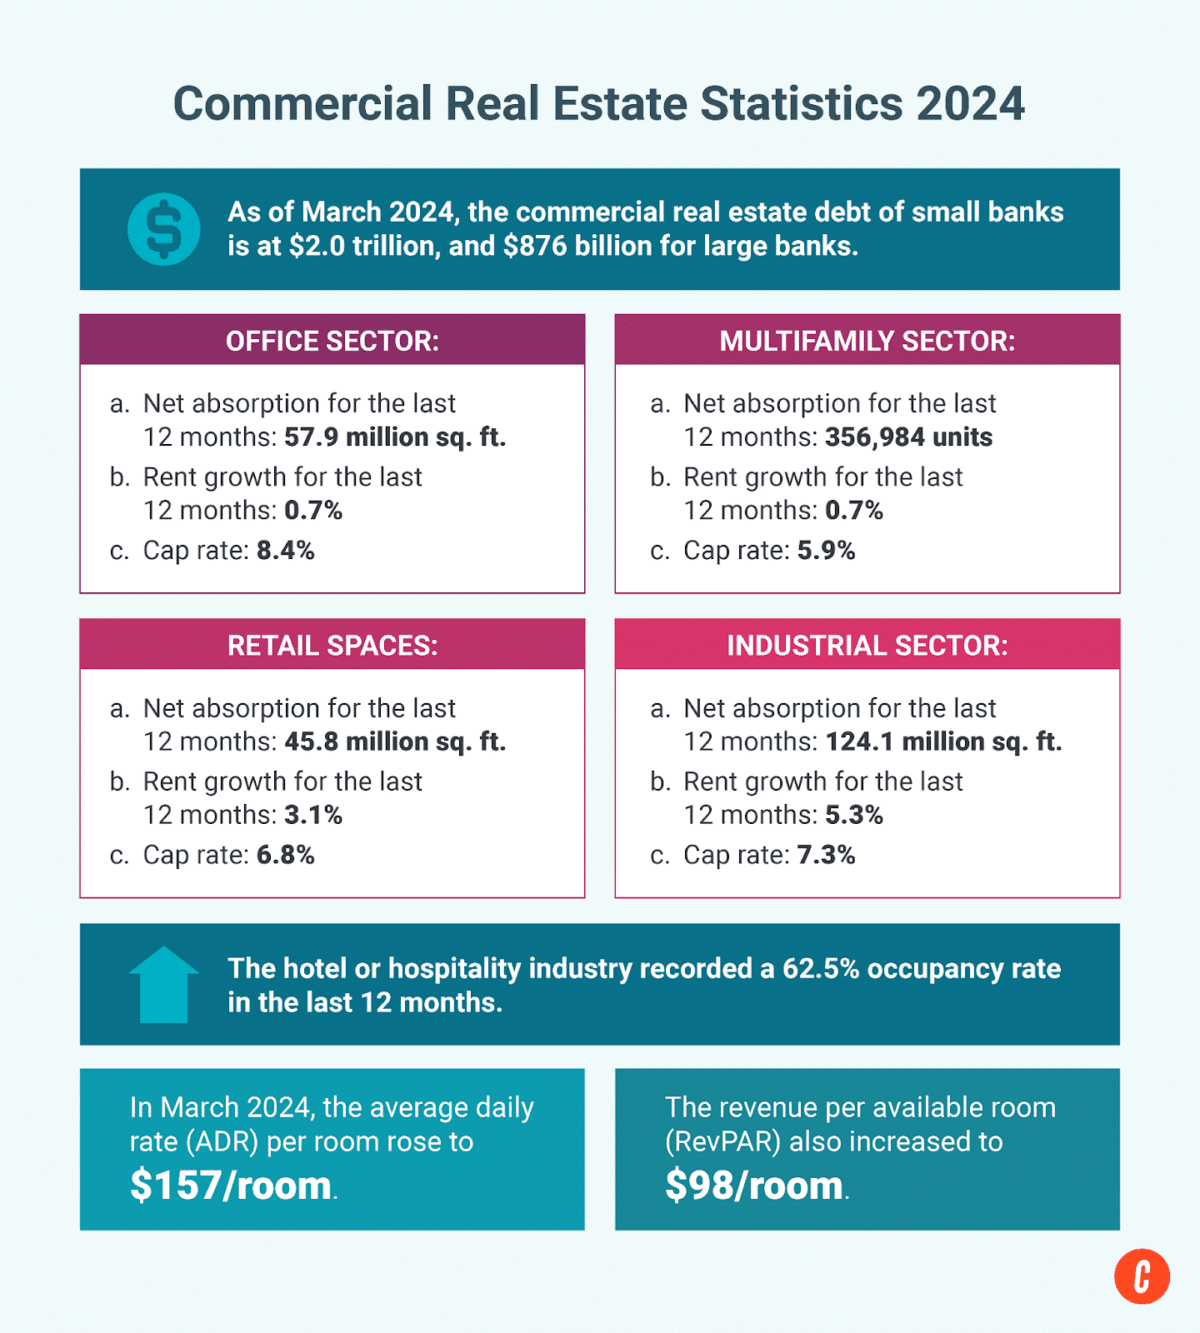
59. As of March 2024, small banks’ commercial real estate debt is at $2.0 trillion and $876 billion for large banks.[16]
60. Net absorption of the offices sector for the last 12 months is -57.9 million sq. ft.[16]
61. The office sector rent growth for the last 12 months is 0.7%, and the cap rate is 8.4%.[16]
62. Net absorption of the multifamily sector for the last 12 months is 356,984 units.[16]
63. The multifamily sector rent growth for the last 12 months is 0.7%, and the cap rate is 5.9%.[16]
64. Net absorption of the retail spaces for the last 12 months is 45.8 million sq. ft.[16]
65. The retail spaces rent growth for the last 12 months is 3.1%, and the cap rate is 6.8%.[16]
66. Net absorption of the industrial sector for the last 12 months is 124.1 million sq. ft.[16]
67. The industrial sector rent growth for the last 12 months is 5.3%, and the cap rate is 7.3%.[16]
68. The hotel or hospitality industry recorded a 62.5% occupancy rate in the last 12 months.[16]
69. In March 2024, the average daily rate (ADR) per room rose to $157/room, up 19% from March of 2020.[16]
70. The revenue per available room (RevPAR) also increased to $98/room, up 13% compared with that in the same period in 2020.[16]
Real Estate Lead Generation Statistics
Why These Stats Matter
All real estate agents and brokers should include lead generation strategies in their business plans. Educating yourself about general lead generation realtor statistics will help you formulate your strategy and ensure that you make decisions based on success rates and target the correct audience. If you need help with your social media, consider working with a real estate marketing company like Coffee & Contracts to automate and streamline your social media content and management.
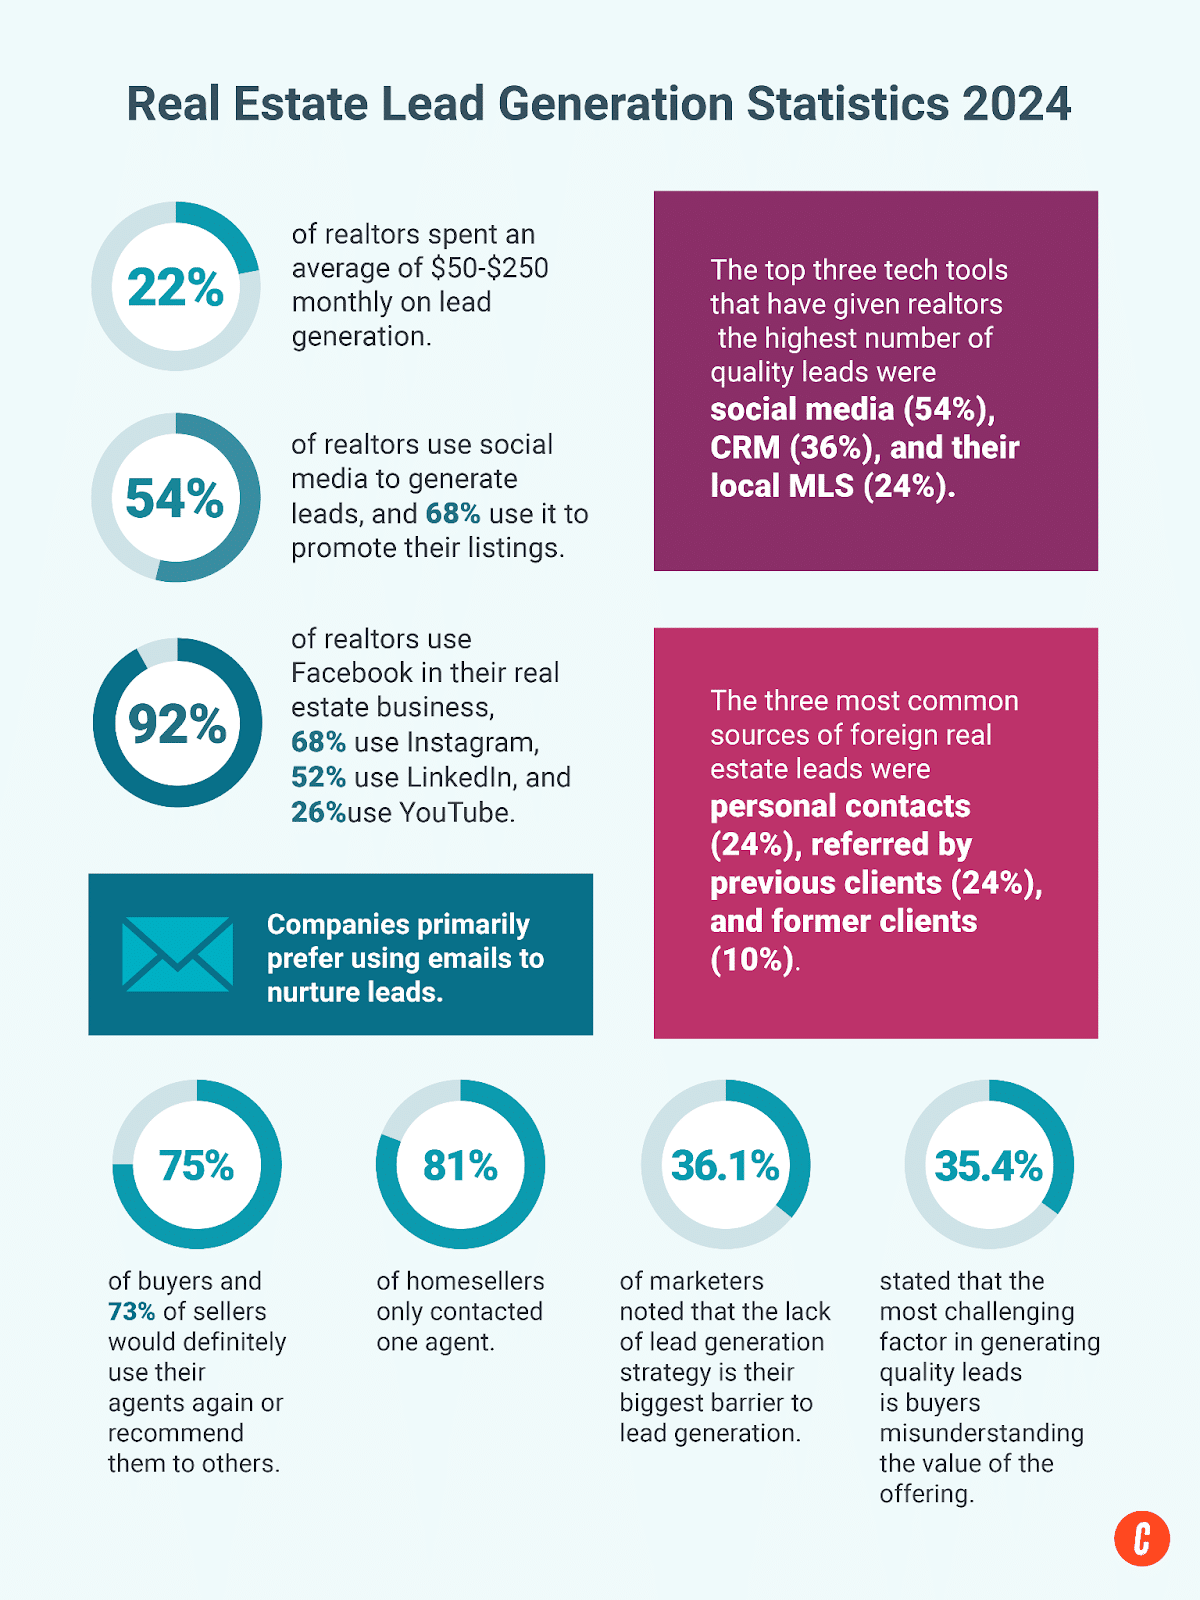
71. 22% of realtors spent an average of $50–$250 monthly on lead generation.[17]
72. 52% of realtors use social media to generate leads, and 68% use it to promote their listings.[17]
73. 92% of realtors use Facebook in their real estate business, 68% use Instagram, 52% use LinkedIn, and 26% use YouTube.[17]
74. The top three tech tools that have given realtors the highest number of quality leads in the last 12 months were social media (54%), CRM (36%), and their local MLS (24%).[17]
75. The three most common sources of foreign real estate leads were personal contacts (24%), referrals by previous clients (24%), and former clients (10%).[18]
76. 75% of home buyers and 73% of sellers would definitely use their real estate agents again or recommend them to others.[2]
77. 81% of home sellers only contacted one agent before selecting one to assist with the home selling process.[2]
78. 36.1% of marketers noted that the lack of lead generation strategy is their biggest barrier to lead generation.[19]
79. In a survey of US marketing decision-makers, 35.4% stated that the most challenging factor in generating quality leads is the buyer’s misunderstanding of the value of the offering.[20]
80. Companies primarily prefer using emails to nurture leads, with almost half of the respondents selecting it as their top method, followed by scheduled calls/demos and social media.[19]
Sold.com is a free real estate referral service that connects local real estate agents with homeowners looking to sell their properties. By providing personalized recommendations and data-driven insights, Sold.com aims to help agents save time, reduce stress, and improve sales outcomes for their clients. The platform takes a tailored approach to each homeowner’s unique situation, ensuring that agents are connected with motivated sellers who are ready to make a move
Visit Sold.comHow Many Realtors Are There in Each State in 2024?
Understanding the number of real estate agents in each state in 2024 is crucial for real estate professionals. This data offers valuable insights into the competitive landscape in local markets and provides a deeper understanding of industry dynamics. By knowing how real estate agents are distributed across different states, agents can fine-tune their strategies, pinpoint areas with growth potential, and thrive in an ever-changing market.
| State/Territory | Number of Agents | State/Territory | Number of Agents |
|---|---|---|---|
| Alabama | 18,653 | Montana | 5,724 |
| Alaska | 1,915 | Nebraska | 5,389 |
| Arizona | 53,422 | Nevada | 19,451 |
| Arkansas | 11,251 | New Hampshire | 6,526 |
| California | 204,687 | New Jersey | 59,593 |
| Colorado | 27,303 | New Mexico | 7,661 |
| Connecticut | 18,983 | New York | 61,799 |
| Delaware | 4,332 | North Carolina | 54,655 |
| District of Columbia (Washington, D.C.) | 2,838 | North Dakota | 2,051 |
| Florida | 225,563 | Ohio | 37,035 |
| Georgia | 47,086 | Oklahoma | 13,962 |
| Hawaii | 10,308 | Oregon | 18,001 |
| Idaho | 11,619 | Pennsylvania | 38,701 |
| Illinois | 49,137 | Rhode Island | 5,210 |
| Indiana | 20,887 | South Carolina | 25,634 |
| Iowa | 8,060 | South Dakota | 2,262 |
| Kansas | 10,425 | Tennessee | 35,661 |
| Kentucky | 13,108 | Texas | 150,141 |
| Louisiana | 15,799 | Utah | 19,237 |
| Maine | 5,629 | Vermont | 1,787 |
| Maryland | 27,195 | Virginia | 34,607 |
| Massachusetts | 25,056 | Washington | 20,893 |
| Michigan | 34,804 | West Virginia | 3,410 |
| Minnesota | 21,809 | Wisconsin | 16,925 |
| Mississippi | 7,446 | Wyoming | 2,633 |
| Missouri | 26,138 | Source: RubyHome | |
Bringing It All Together
Understanding the ever-changing real estate industry is important, especially when the market is weak. You can use these real estate agent statistics in many ways, like knowing which city is best for realtors, deciding on real estate investing, starting a conversation, writing blog posts, or creating social media content. By using these realtor statistics, you can show that you know what’s happening in the market in your area and stand out.
If there are real estate numbers we didn’t include that you want to know, just leave a comment. These real estate facts are a great way to start talking about real estate. Let’s keep talking!
Sources
1. Residential Real Estate Market Snapshot Report
2. 2024 Home Buyers and Sellers Generational Trends Report
3. 2023 Profile of Home Buyers and Sellers
4. May 2024 Monthly Housing Market Trends Report
5. Real Estate—Worldwide | Statista Market Forecast
7. United States Housing Market & Prices | Redfin
8. Most Expensive States to Live in 2024
9. 10 Most Expensive Cities to Own a Home in 2024
10. 10 Most Affordable Cities To Buy A Home In 2024—Forbes Advisor
11. Examining the Cost of Living by State in 2024
12. Renters: Results from the Zillow Consumer Housing Trends Report 2023
14. The Most and Least Expensive Cities for Renters in 2023 | Apartments.com
16. Commercial Real Estate Market Insights Report
18. Realtors: lead sources for foreign buyers US 2023 | Statista
19. 27 Lead Generation Statistics and Trends for 2023
20. Difficulties with B2B qualified lead generation US 2021 | Statista