


The 2026 housing market continues to shift amid affordability challenges, rising inventory, changing buyer behavior, and evolving economic conditions. Buyers are becoming more selective, sellers are facing more competition, and consumers are increasingly prioritizing flexibility, affordability, and long-term value when making housing decisions.
At the same time, trends such as growth in relocation, investor activity, wealth disparities, and shifting home preferences are creating new opportunities and challenges across the market.
So how does all of that affect you as a real estate agent? Understanding these market shifts can allow you to educate, inform, and guide buyers and sellers through these challenges. You’ll also be able to set the right expectations up front, no matter what their circumstances are. At the end of the day, this can help position you as the go-to expert for your clients.
- 1. New homes are becoming cheaper than existing homes
- 2. The first two weeks on the market matter the most
- 3. Buyers are searching for down payment help more than ever
- 4. Buyers now have more negotiating power
- 5. Many buyers are now open to renting instead of buying
- 6. Older Americans now hold a record share of real estate wealth
- 7. House hunters are increasingly looking to relocate
- 8. Buyers are still chasing affordability in smaller markets
- 9. Homeowners are staying in their homes longer than ever
- 10. Buyers are prioritizing smaller, more functional homes
- 11. Raw land prices surged faster than developed lots
- 12. Americans are more likely to oppose AI data centers than new housing
- 13. Foreclosures remain well below historic crash levels
- 14. Airport traffic is becoming an unexpected signal for future housing demand
- 15. Cash buyers are still active, but no longer dominating the market
- 16. Wealthy Americans are allocating less of their portfolio to real estate
- 17. Housing costs remain the biggest driver behind America’s affordability crisis
- 18. Homeowners hold dramatically more wealth than renters
- 19. Major short-term rental income opportunities
- 20. Small home projects can deliver some of the biggest returns on investment
- Frequently asked questions (FAQs)
- Your take
1. New homes are becoming cheaper than existing homes
Traditionally, new construction homes have sold at a premium compared to existing homes. But in today’s market, that trend has started to reverse. According to an analysis of US Census Bureau and National Association of Realtors data, new homes sold at a median price of $405,300 in the fourth quarter, while existing homes sold for $414,933. Much of that shift is being driven by builders offering incentives such as closing-cost assistance, mortgage rate buydowns, and free upgrades to attract buyers in an affordability-constrained market.
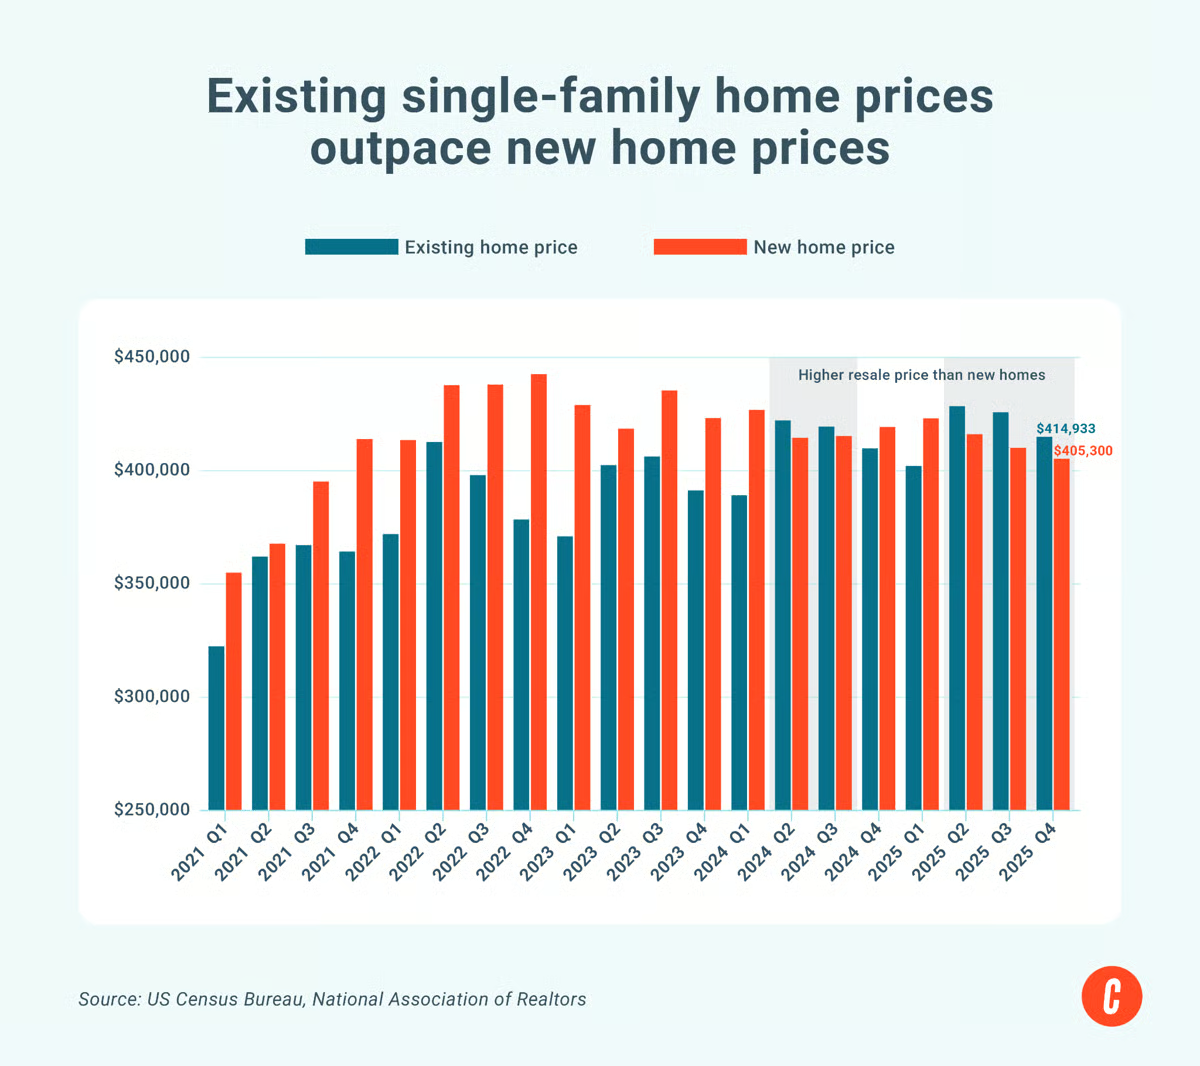
For buyers, this creates more opportunities to find affordable options in the new-construction space, especially as builders continue to compete aggressively for demand. As a real estate agent, it’s important to keep this trend in mind when helping clients compare resale properties with newly built homes. Sellers may also need to price more competitively as buyers gain more leverage and flexibility in today’s market.
2. The first two weeks on the market matter the most
While the housing market has slowed compared to the pandemic frenzy, the best listings are still moving quickly. According to Zillow, 18.5% of homes nationwide went pending within seven days in February 2026. Homes that sold within a week were also 2.6 times more likely to sell above asking price compared to other listings.
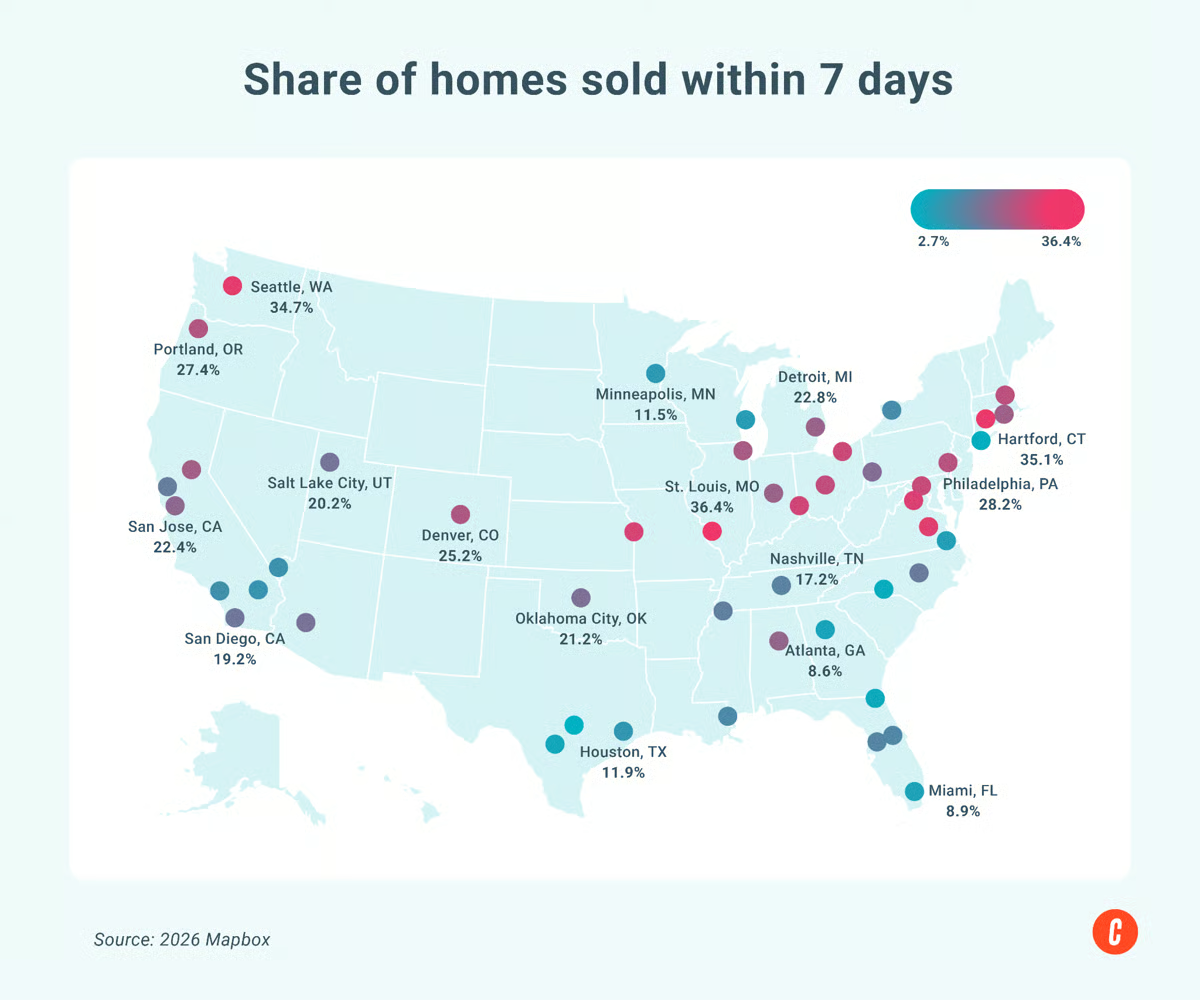
Today’s market has become more selective, with buyers taking their time on overpriced or poorly positioned homes while moving aggressively on listings that are priced correctly and marketed well from the start. The first couple of weeks on the market are especially important, as strong early interest can still create competition and multiple-offer situations.
3. Buyers are searching for down payment help more than ever
Affordability concerns continue to weigh heavily on buyers, and many are now seeking answers about how much they need to purchase a home. According to Google Trends data from Keeping Current Matters, searches for down payments recently hit an all-time high, a sign that more buyers are actively researching financing options before entering the market.
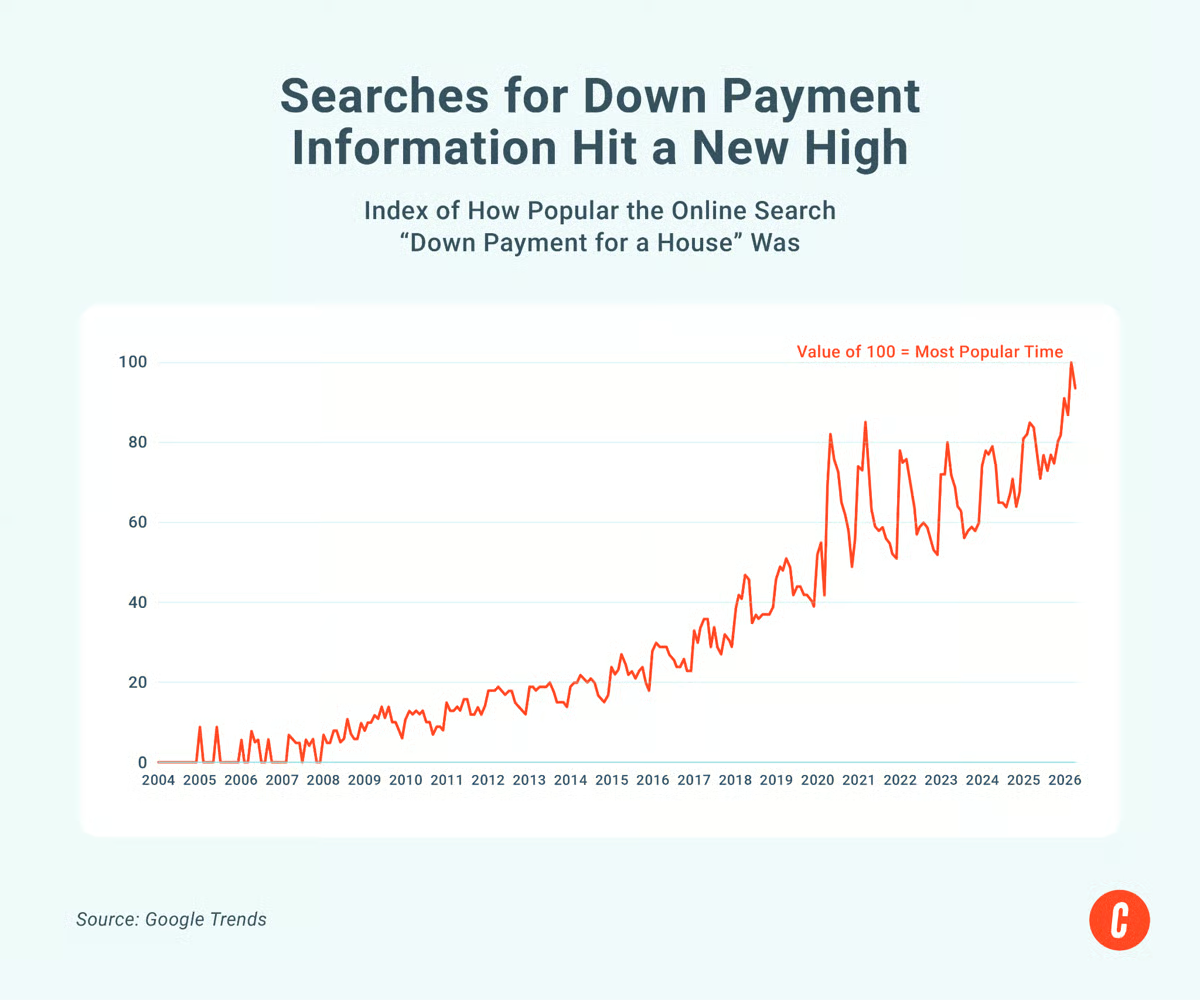
One of the biggest misconceptions buyers still have is that a 20% down payment is required, when in reality the median down payment for first-time homebuyers is just 10%. As a real estate agent, this creates an opportunity to educate buyers who may feel discouraged by today’s housing market. Helping buyers better understand their financing options can position you as a trusted resource and potentially help them enter the market sooner than they expected.
4. Buyers now have more negotiating power
After years of intense competition and limited inventory, the housing market has shifted more in favor of buyers. According to Redfin, there are 43.1% more sellers than buyers in the market in March 2026, one of the largest gaps recorded since 2013. As inventory grows and affordability challenges continue to sideline some buyers, many sellers are finding that homes are taking longer to sell and attracting fewer offers than they would have just a few years ago.
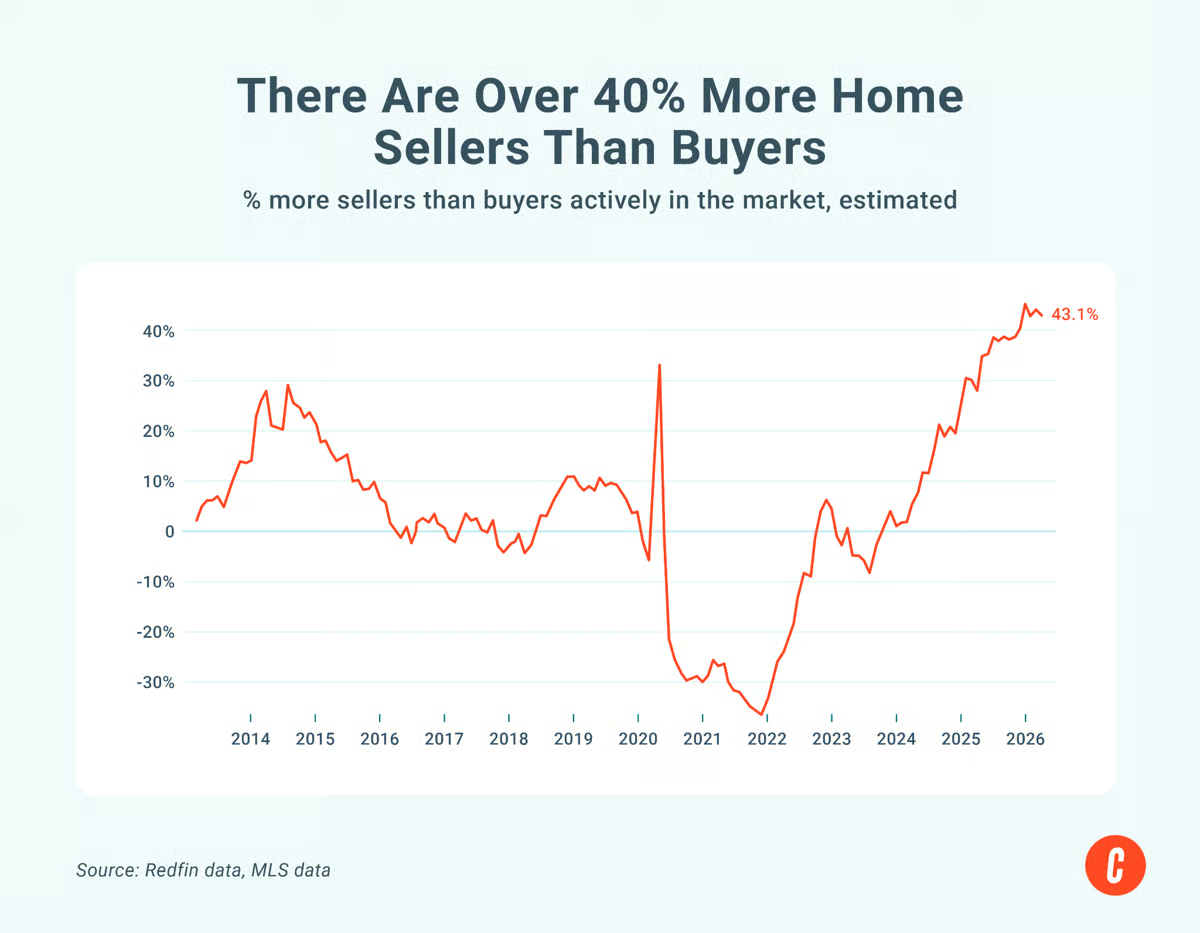
For buyers, this creates more flexibility and negotiation leverage, especially in markets where inventory has risen sharply. As a real estate agent, you have an important opportunity to help buyers understand that today’s market may offer more room for negotiation, concessions, and price reductions. At the same time, sellers may need to focus more heavily on pricing strategy, presentation, and marketing as competition between listings continues to increase.
5. Many buyers are now open to renting instead of buying
Today’s housing market is creating a new type of consumer: the “dual shopper.” According to Zillow, roughly 8% of home shoppers nationwide are also actively browsing rental listings, with the trend especially common in expensive markets like Los Angeles, San Diego, and San Francisco. Rather than committing fully to buying, many consumers are now keeping both options open as they compare affordability, monthly costs, and lifestyle flexibility.
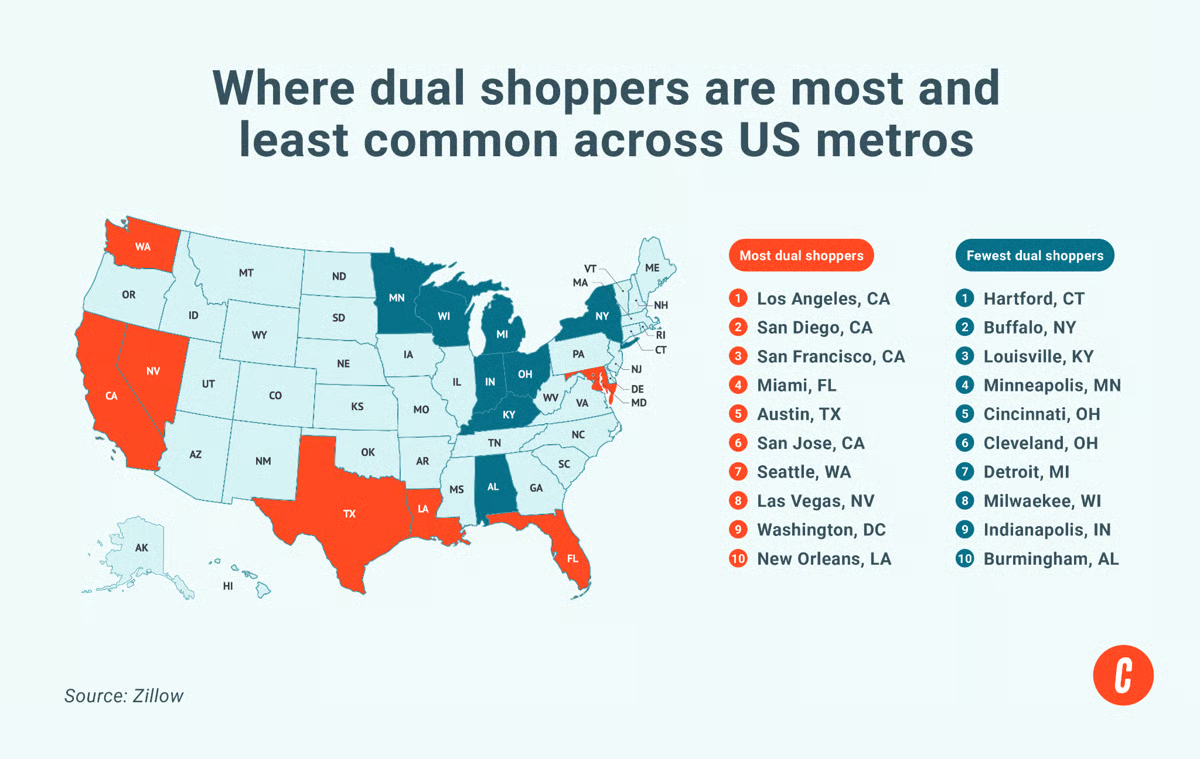
This shift highlights how buyer priorities have changed in today’s market. Higher mortgage rates and affordability concerns are causing many clients to approach homeownership more cautiously than they did just a few years ago. Buyers may still want to purchase eventually, but many are taking more time to evaluate whether renting or buying makes the most financial sense right now.
6. Older Americans now hold a record share of real estate wealth
For the first time on record, Americans aged 70 and older now hold as much real estate wealth as the 40 to 54 age group. According to Redfin, the 70-plus demographic held 26% of the nation’s real estate wealth in 2025, up significantly from just 16.6% two decades ago. Meanwhile, younger generations have struggled to gain ground as rising home prices and higher mortgage rates continue making homeownership more difficult to achieve.
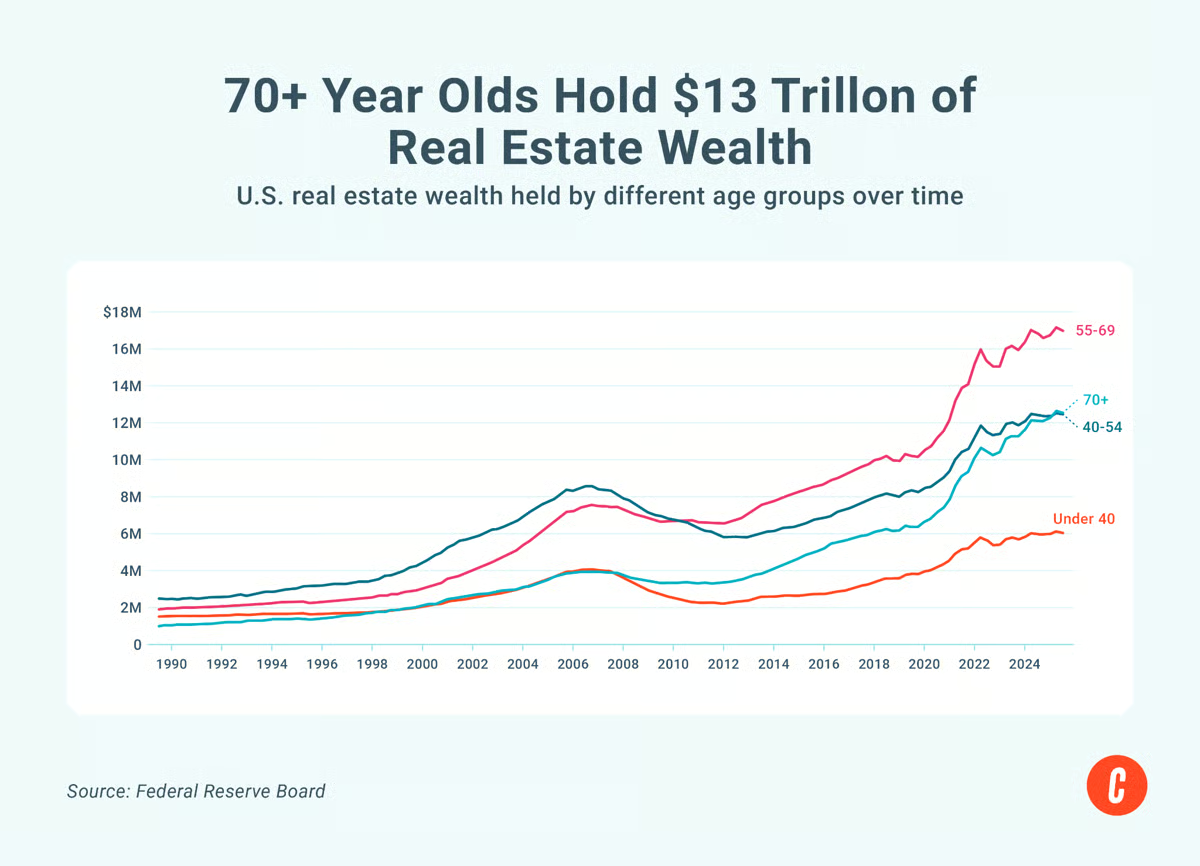
This chart highlights how much the housing market has shifted across generations. Older homeowners have benefited from decades of home appreciation and lower mortgage rates, while younger buyers are entering the market later and facing greater affordability challenges. Understanding these dynamics can help agents better tailor conversations around affordability, equity growth, downsizing, and long-term wealth building, depending on each client’s stage of life.
7. House hunters are increasingly looking to relocate
Americans are becoming increasingly open to relocating, with nearly 1 in 5 home shoppers now searching for homes in a different part of the country. Redfin reports 18.8% of buyers and renters are looking to move to a different metro area in late 2025, up from 15.9% five years ago. Many buyers continue to prioritize affordability, lifestyle preferences, lower taxes, and remote-work flexibility when deciding where to live, helping drive migration to more affordable Sun Belt and secondary markets.
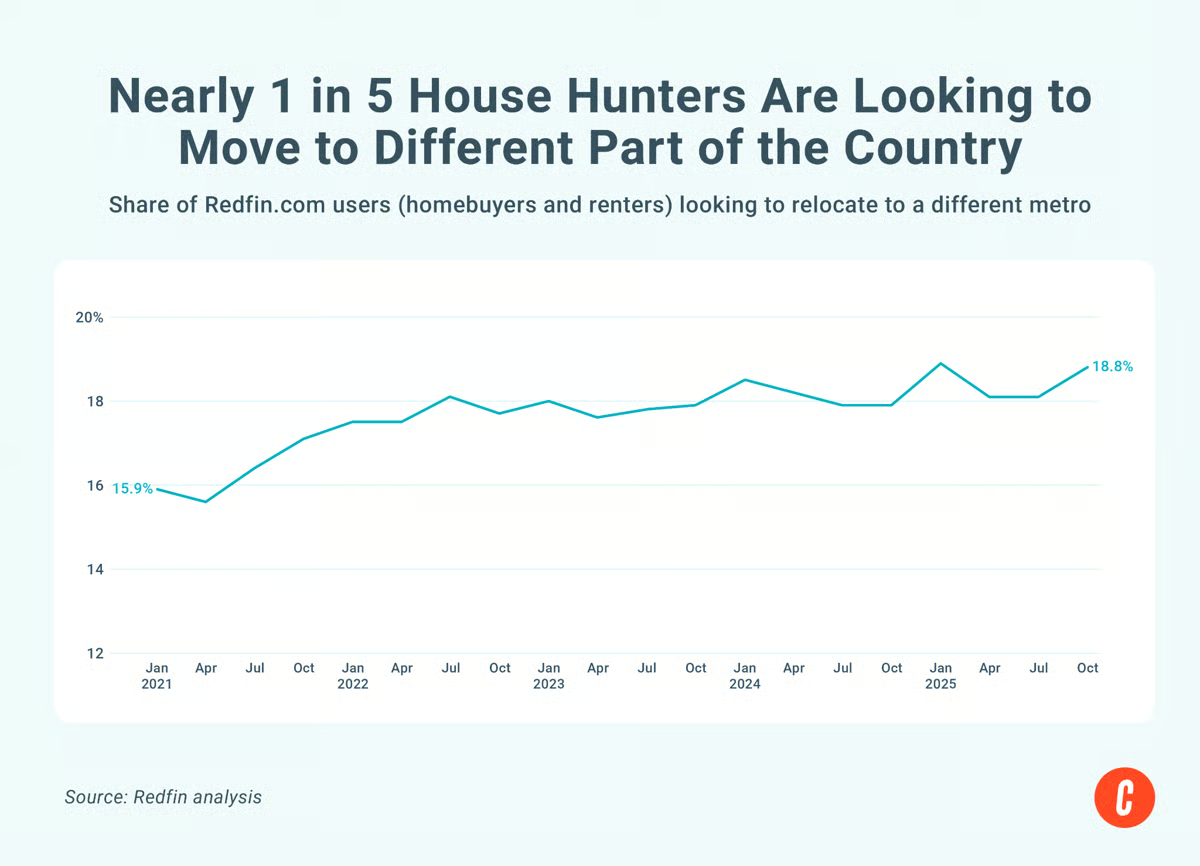
For agents, this highlights the opportunity of relocation and long-distance buyers. Many consumers are now more likely to move across state lines, and agents who market themselves as relocation experts and have strong local market expertise are positioning themselves to capture these buyers.
8. Buyers are still chasing affordability in smaller markets
As the national housing market continues to balance out, buyers are still gravitating toward markets where their money can go further. Realtor.com announced the top housing markets for 2026, including Hartford, Rochester, Worcester, Toledo, and Providence. These markets are relatively affordable compared to nearby high-cost metros, while limited inventory and steady demand are expected to keep prices moving upward.
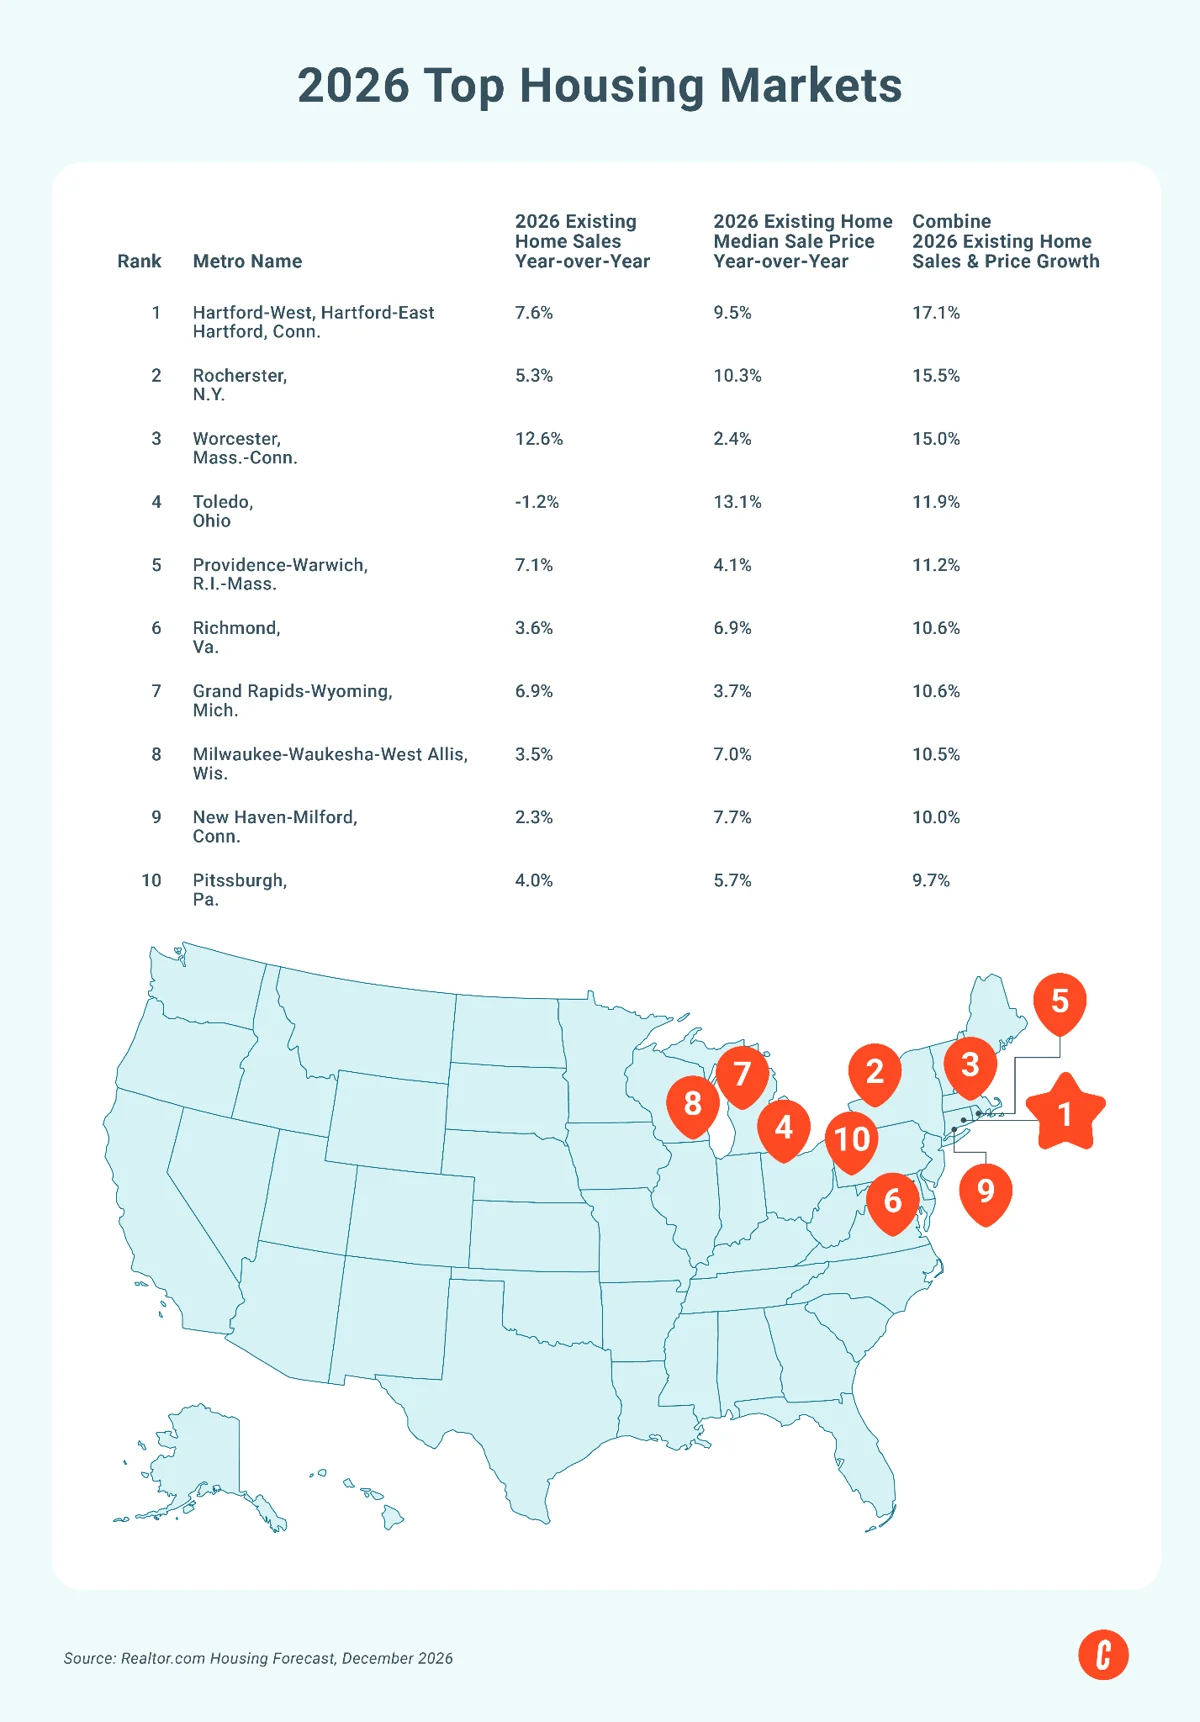
For real estate agents, this trend shows that affordability remains one of the biggest forces shaping buyer behavior. Buyers may be willing to look beyond major hubs if it means finding more space, lower prices, and better long-term financial fit. It’s imperative that agents understand which markets are gaining momentum, so they can better guide relocation buyers, investors, and sellers.
9. Homeowners are staying in their homes longer than ever
Today’s homeowners are holding on to their homes far longer than they did in the past. Recent data reveal that the typical US homeowner now stays in their home for 12 years, nearly double the average tenure in 2005. In some markets, the numbers are even more extreme. Los Angeles homeowners, for example, now stay in their homes for an average of 20 years, helping keep inventory levels tight and limiting the number of homes available for sale.
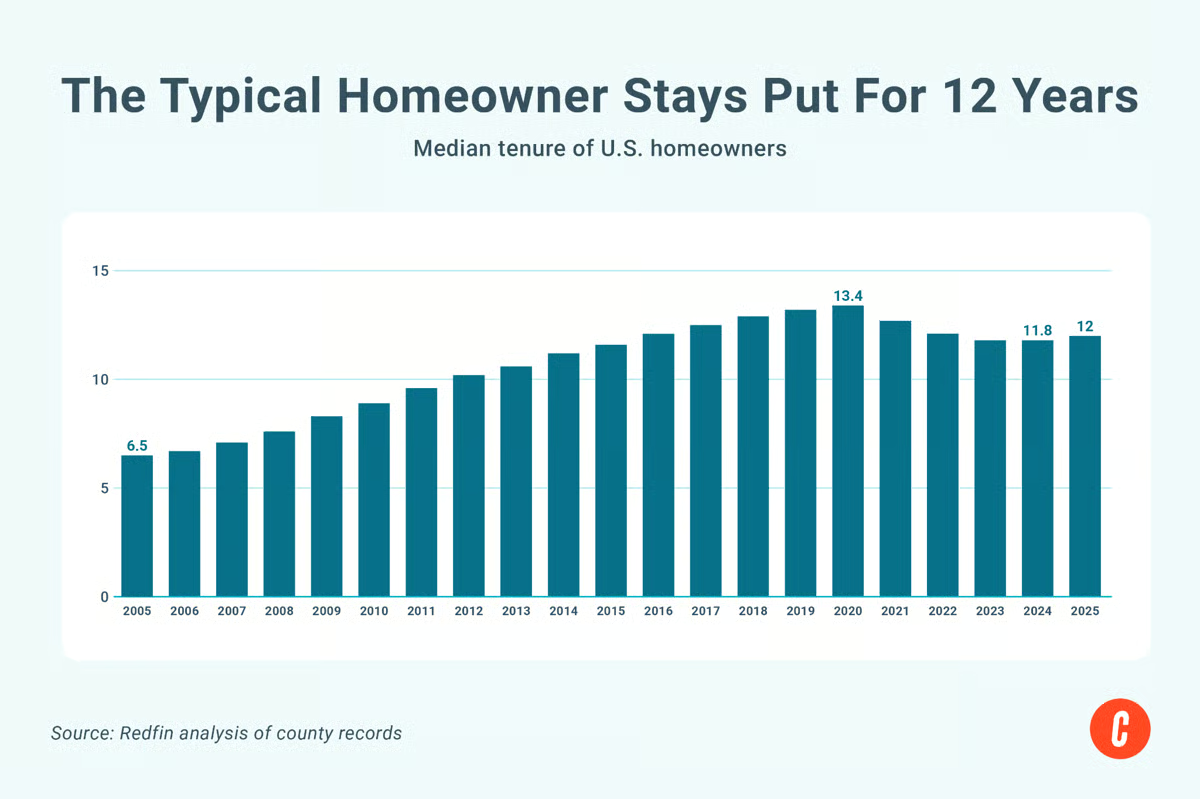
This data helps explain why inventory remains constraining in many markets despite softer buyer demand. Existing homeowners are financially incentivized to stay put because they are locked in at lower mortgage rates or benefit from lower property taxes. While this can create challenges for first-time buyers competing for limited inventory, it also reinforces the importance of building long-term relationships with homeowners who may eventually decide to move, downsize, or relocate.
10. Buyers are prioritizing smaller, more functional homes
As affordability challenges continue shaping buyer behavior, many homebuyers are shifting away from larger homes and focusing more on functionality and efficient use of space. The National Association of Home Builders reports that nearly half of newly built homes in 2025 had three bedrooms. The average size of newly built homes has continued to shrink compared to a decade ago. Builders are increasingly designing homes with practical layouts, flexible living spaces, and outdoor features that better match what today’s buyers actually want and can afford.
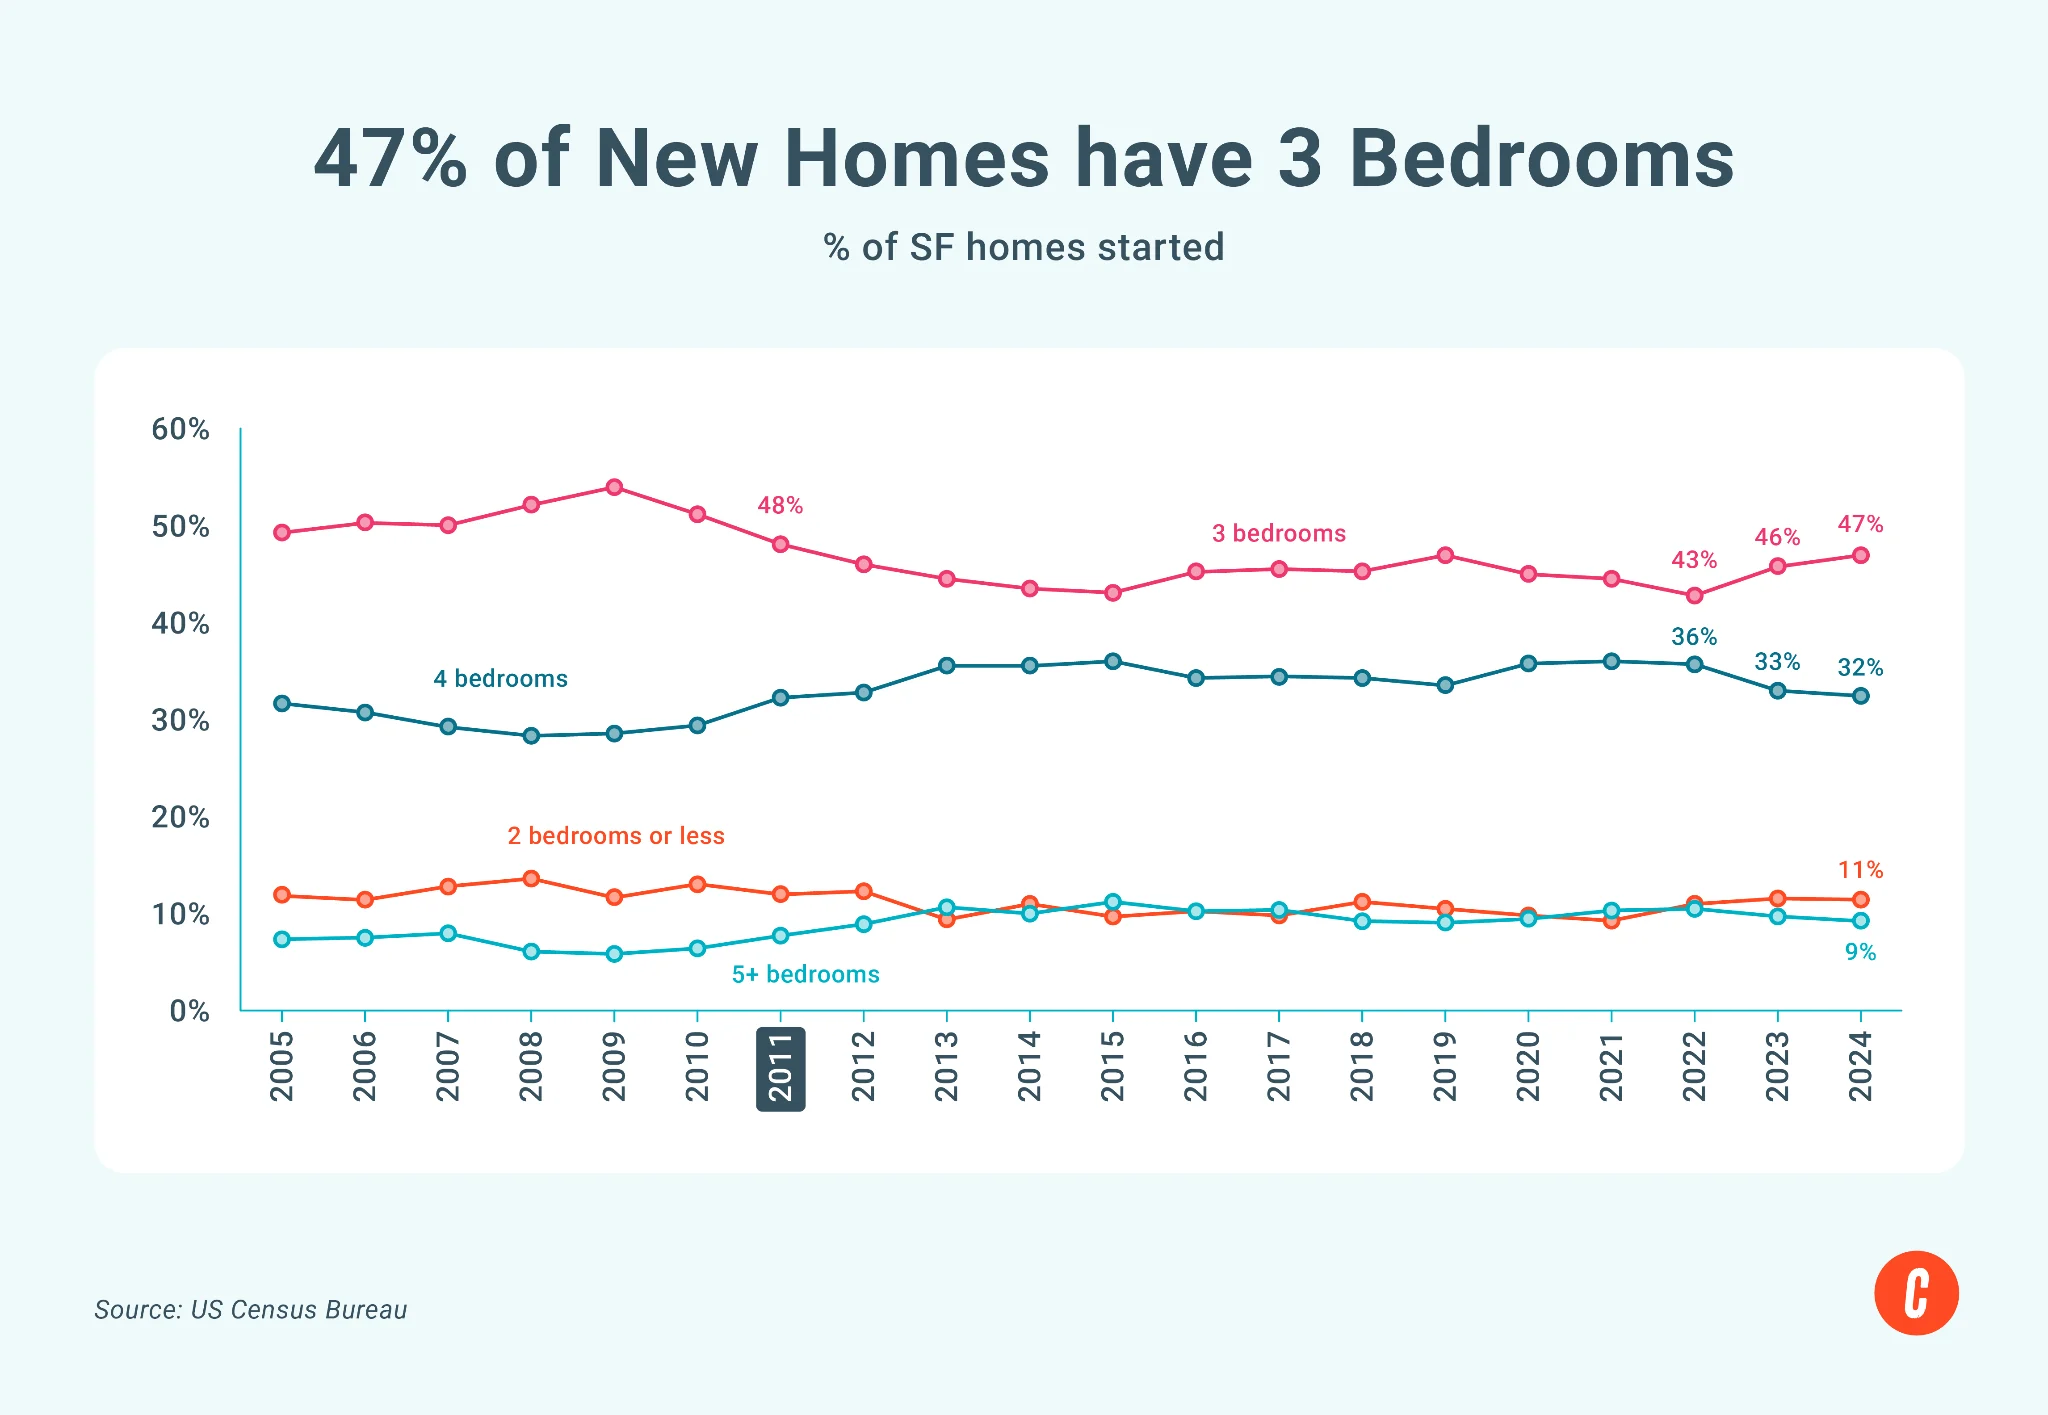
Buyer priorities are evolving in today’s market. Many buyers are becoming less focused on sheer square footage and more interested in smart layouts, storage, outdoor living areas, and homes that feel manageable financially. Understanding these changing preferences can help agents better position listings and guide buyers toward homes that fit both their lifestyle and budget.
11. Raw land prices surged faster than developed lots
The pandemic housing boom didn’t just impact homes; it also sent land prices soaring. According to Realtor.com, raw land prices have increased by nearly 87% since 2019, significantly outpacing build-ready lots and other developed land listings. Much of the demand came from developers and investors looking to secure land during the era of low interest rates and rapid home price growth, helping push underdeveloped acreage values sharply higher over the past several years.
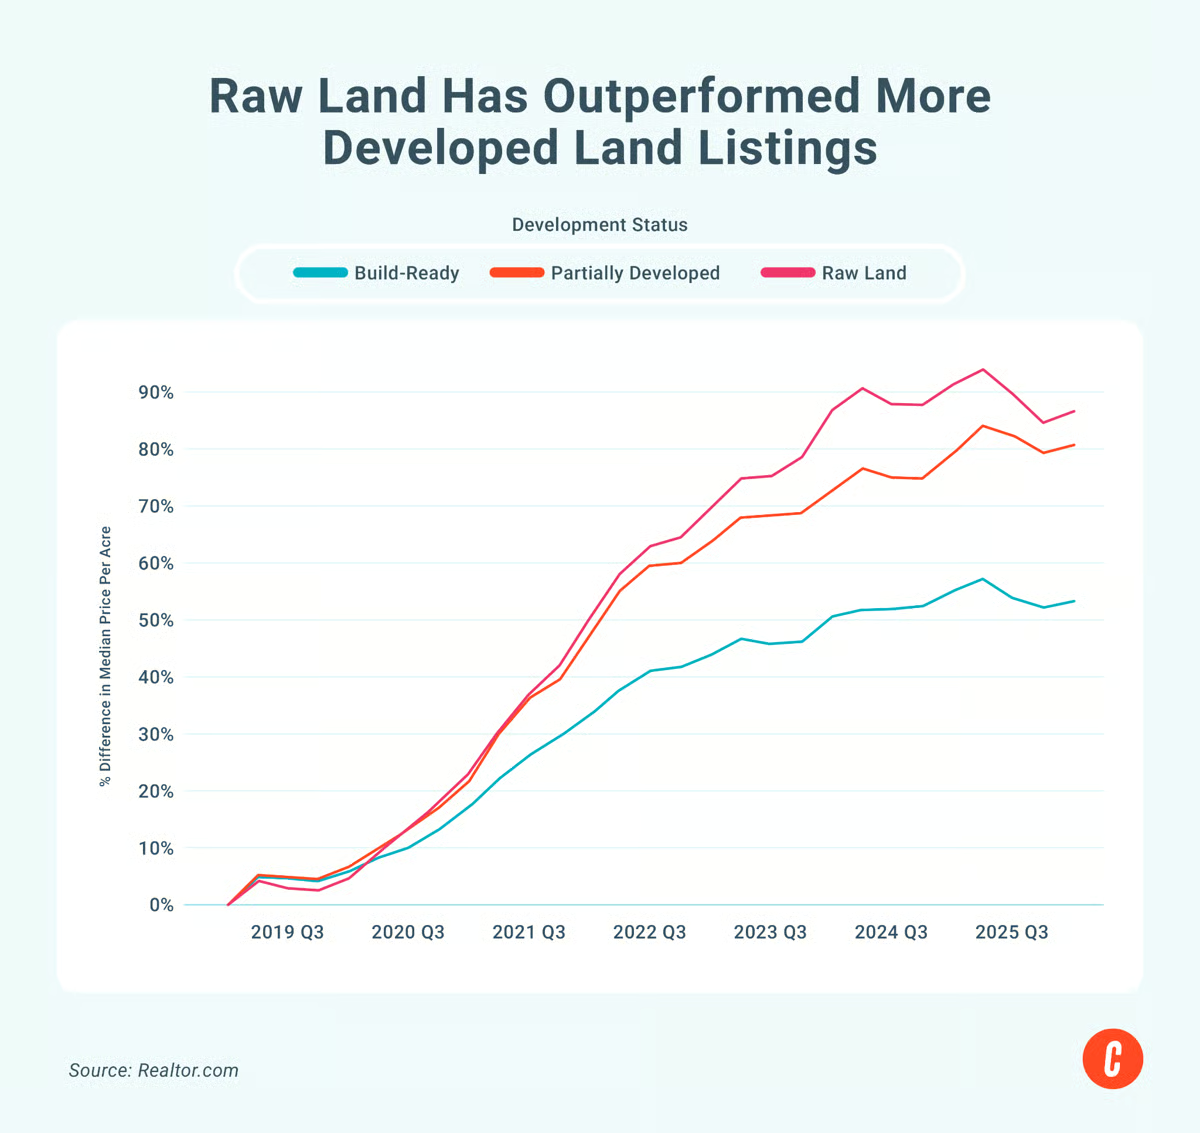
As a real estate agent, this data highlights how demand for future housing development has remained strong even as the broader market cools. At the same time, recent price corrections suggest the land market is beginning to normalize as higher construction costs and slower buyer demand reduce pressure on developers. Understanding these shifts can help agents better evaluate investment opportunities, development trends, and future inventory growth within their local markets.
12. Americans are more likely to oppose AI data centers than new housing
Artificial intelligence continues to expand rapidly, and more communities are debating whether to develop data centers in the area. But according to a Redfin survey, Americans are more likely to oppose AI data centers than other types of property development, with concerns ranging from environmental impact and infrastructure strain to increased energy and water use.
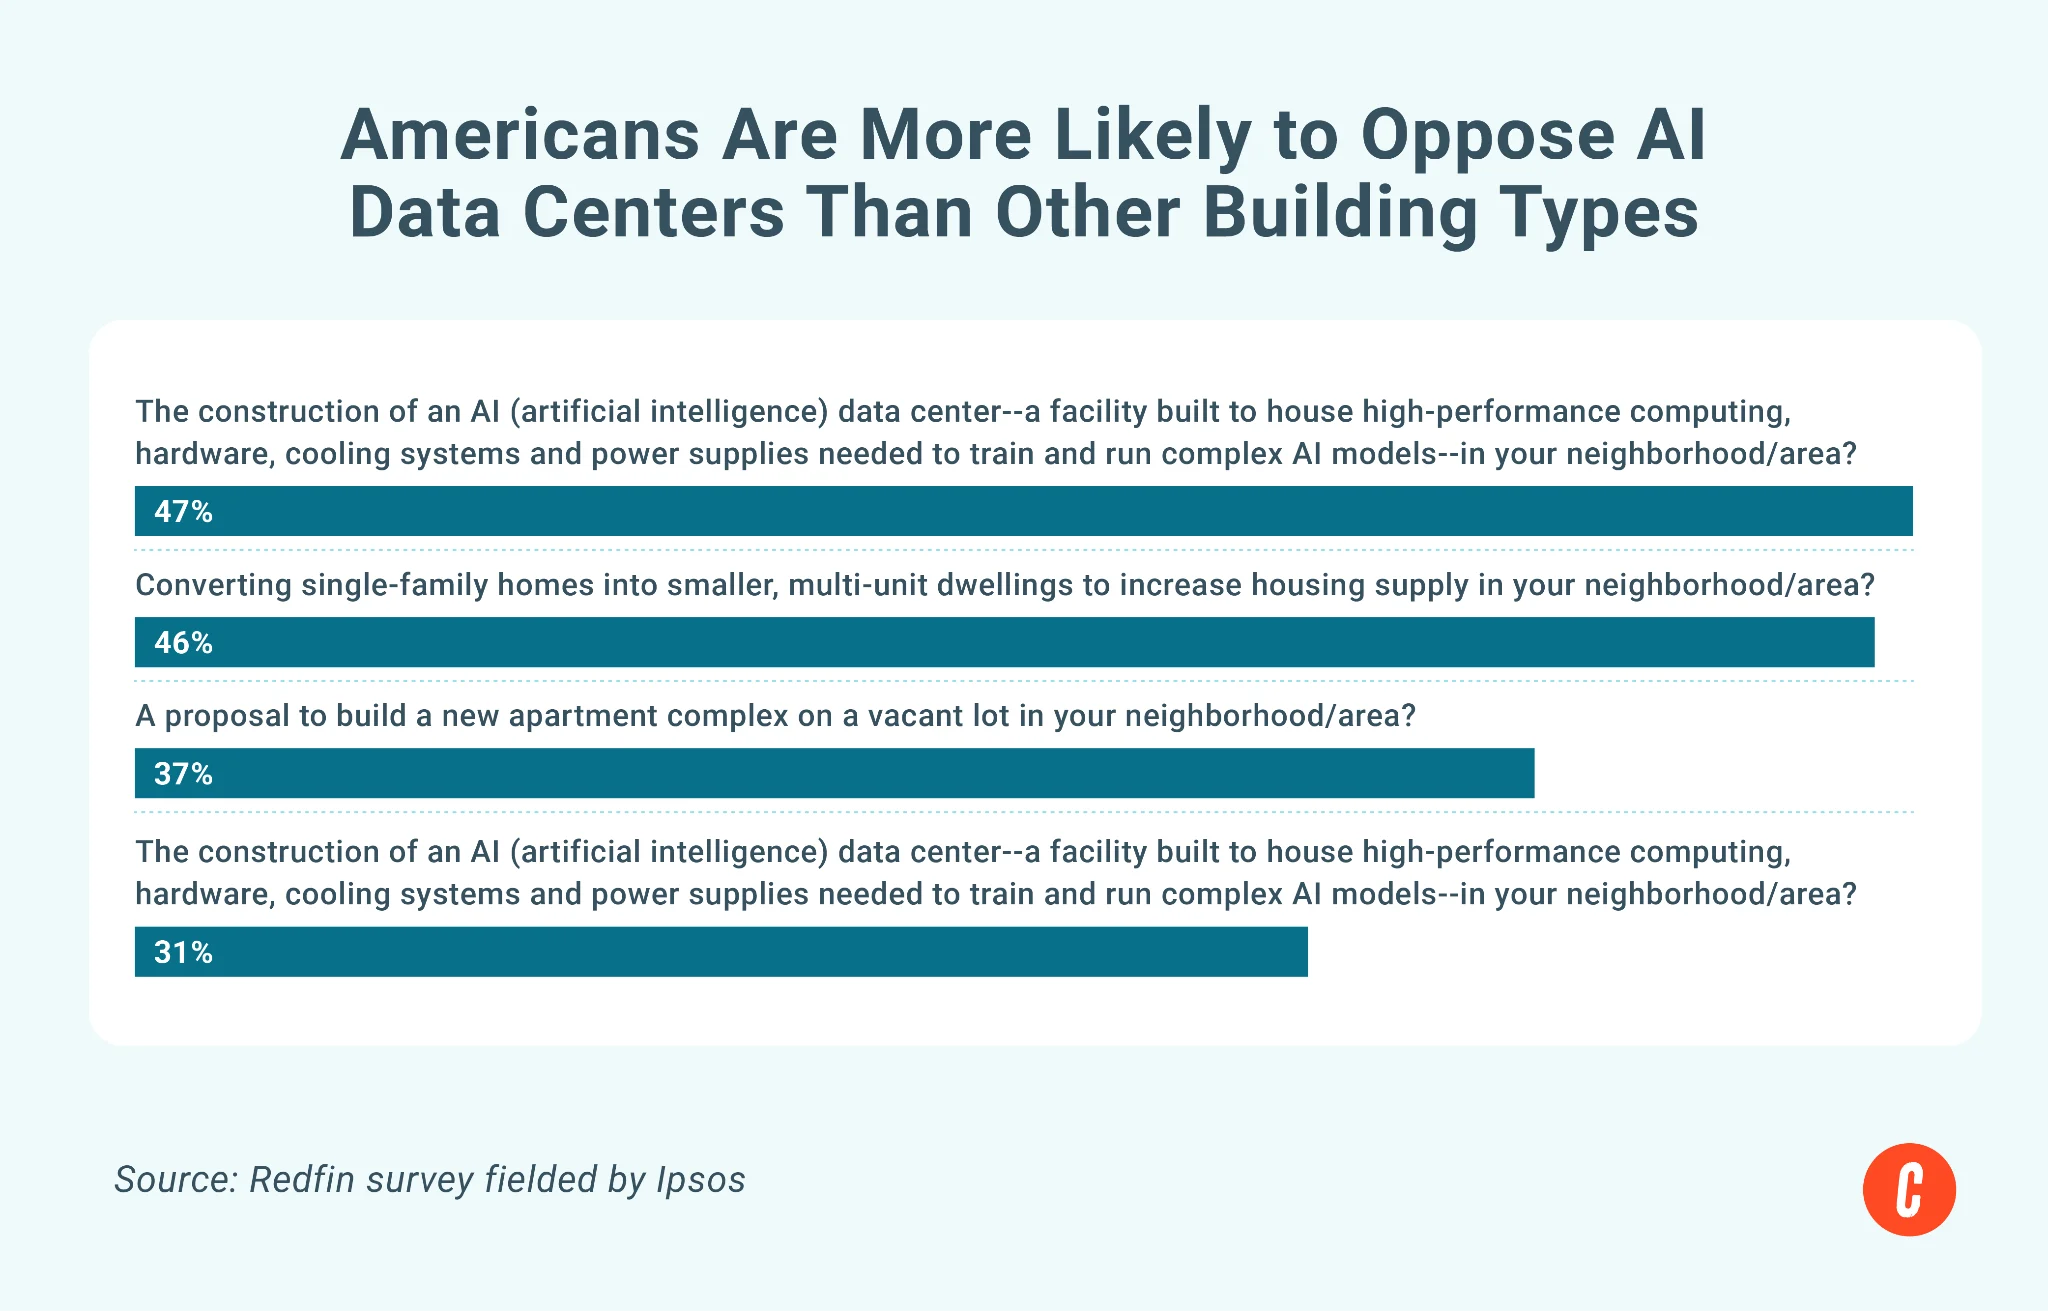
The survey reveals public sentiment on AI data centers, and, as agents, it’s extremely important to understand buyers’ perceptions to better navigate conversations about development, zoning changes, and long-term community growth.
13. Foreclosures remain well below historic crash levels
Foreclosure filings have increased over the past year, but today’s numbers remain far below the levels seen during the 2008 housing crash. ATTOM data from Keep Current Matters show that foreclosure filings have risen gradually as the market has normalized following the pandemic-era moratorium, but overall activity remains below pre-pandemic levels. Many homeowners today are sitting on substantial equity, giving many financially distressed sellers options before foreclosure.
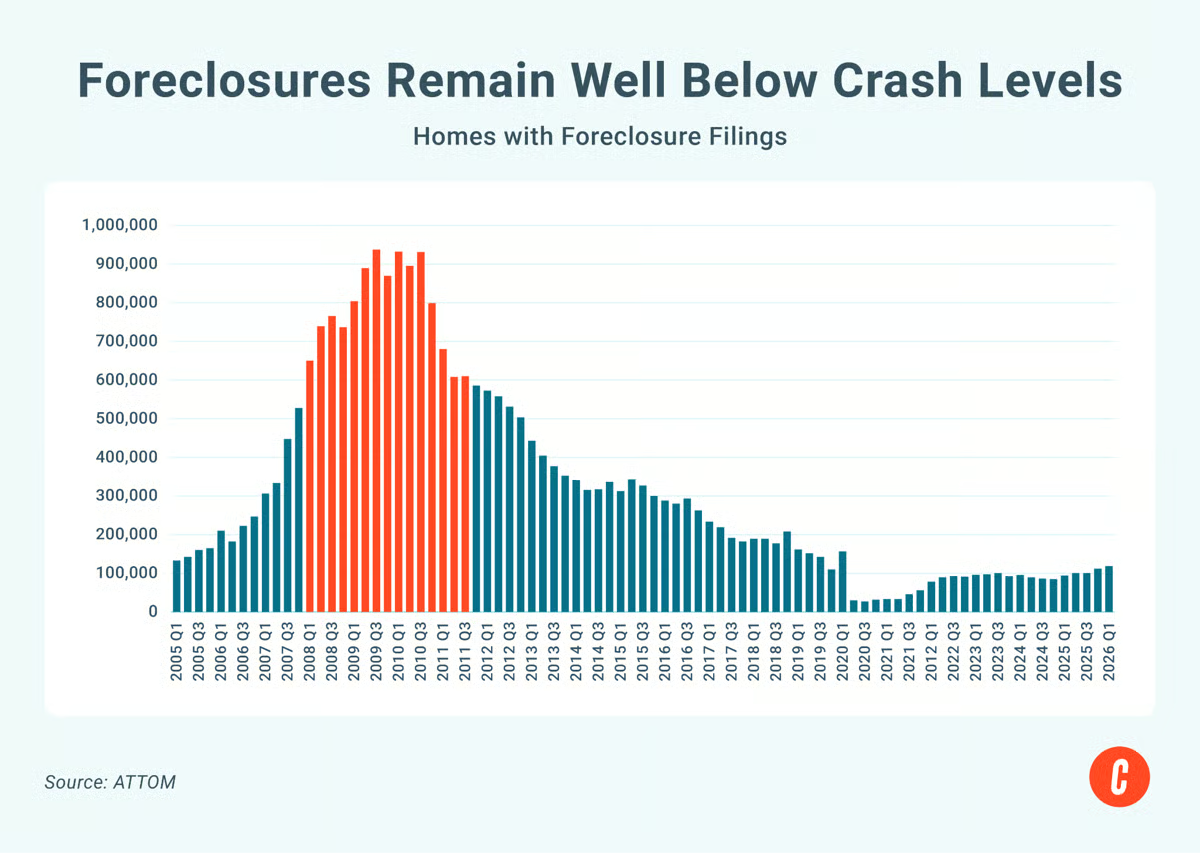
It’s important for agents to understand that many consumers associate rising foreclosures with a potential market collapse. In reality, today’s housing market looks very different from 2008, largely due to stronger homeowner equity positions and tighter lending standards. Understanding this distinction can help agents better educate clients, calm fears fueled by headlines, and guide homeowners toward solutions before financial challenges escalate further.
14. Airport traffic is becoming an unexpected signal for future housing demand
Real estate investors are increasingly looking beyond traditional housing data and paying attention to airport traffic as a sign of long-term growth potential. A recent analysis found that some metros generate far more passenger traffic than their population size alone would suggest, highlighting markets that are driven by business travel, migration patterns, tourism, and economic activity.
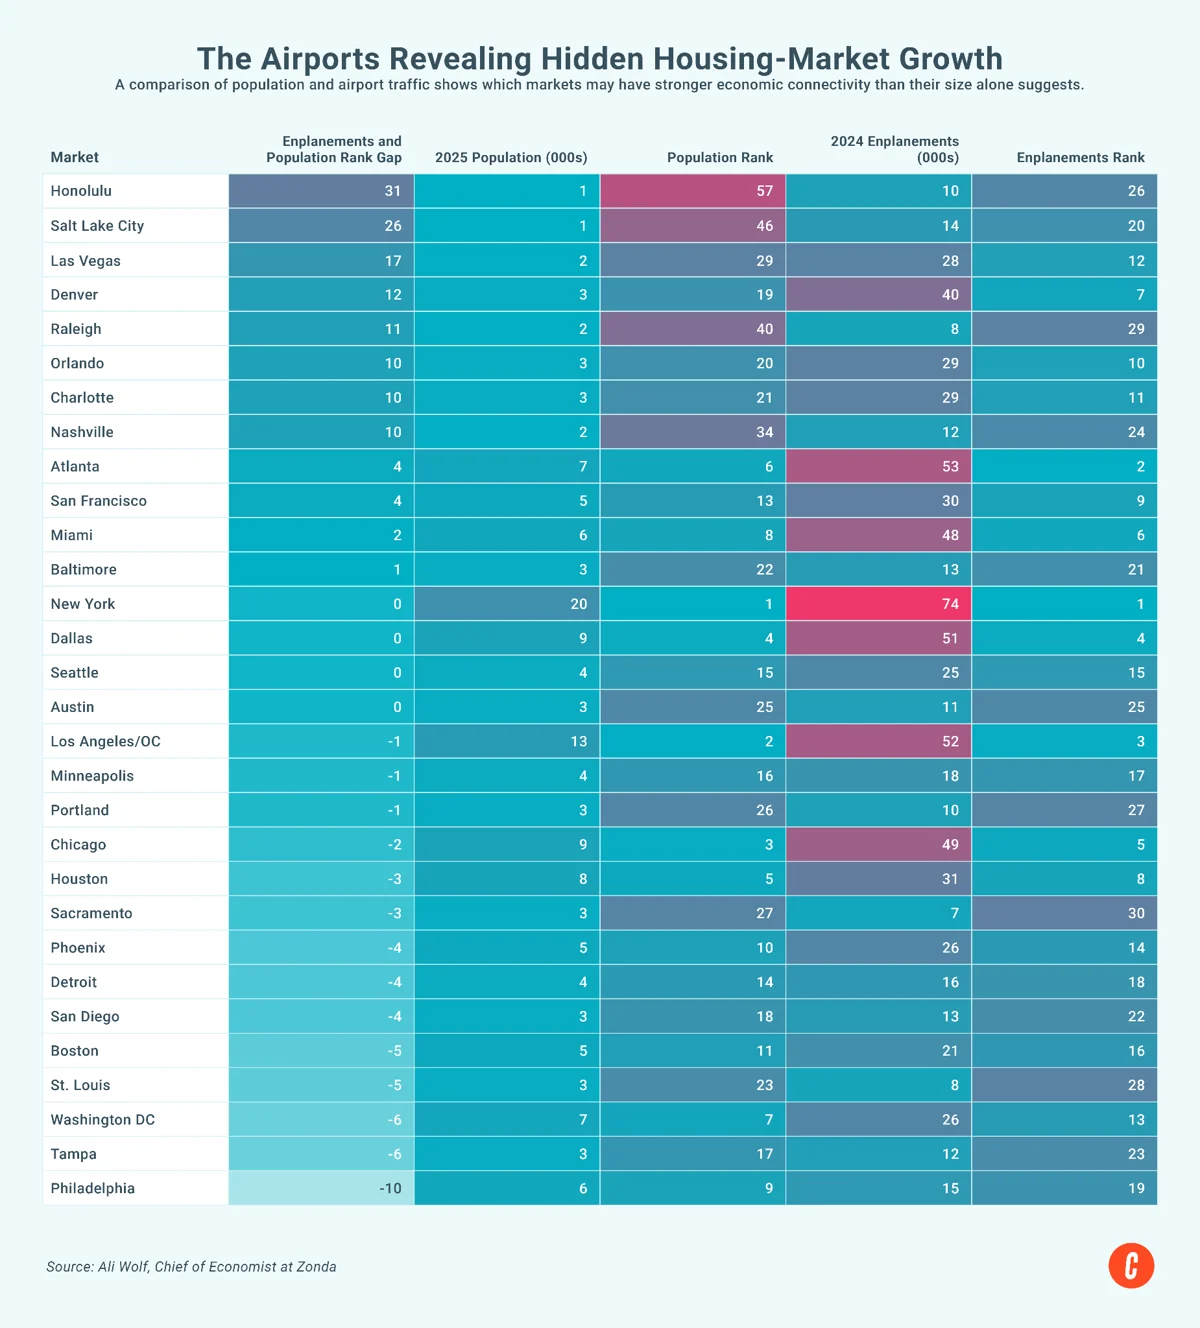
Markets like Charlotte, Dallas, Denver, Orlando, and Las Vegas stand out because strong airport infrastructure can make cities more attractive to employers, remote workers, retirees, and investors over time. Buyers today are not just evaluating home prices and job opportunities; they are also considering convenience, mobility, and access to broader economic networks. Markets with major airport hubs often attract stronger investor interest, more relocation activity, and sustained long-term demand, even during periods when local housing markets temporarily soften.
15. Cash buyers are still active, but no longer dominating the market
Nearly three in ten homes are still purchased with cash, but the share has begun to decline as mortgage rates have eased and buyers have gained more negotiating power. Cash purchases peaked near 35% in late 2023 when mortgage rates climbed into the high-7% range, pushing many buyers to avoid financing altogether. Now, with rates moderating and inventory improving, fewer buyers feel pressure to waive contingencies or make aggressive all-cash offers just to compete.
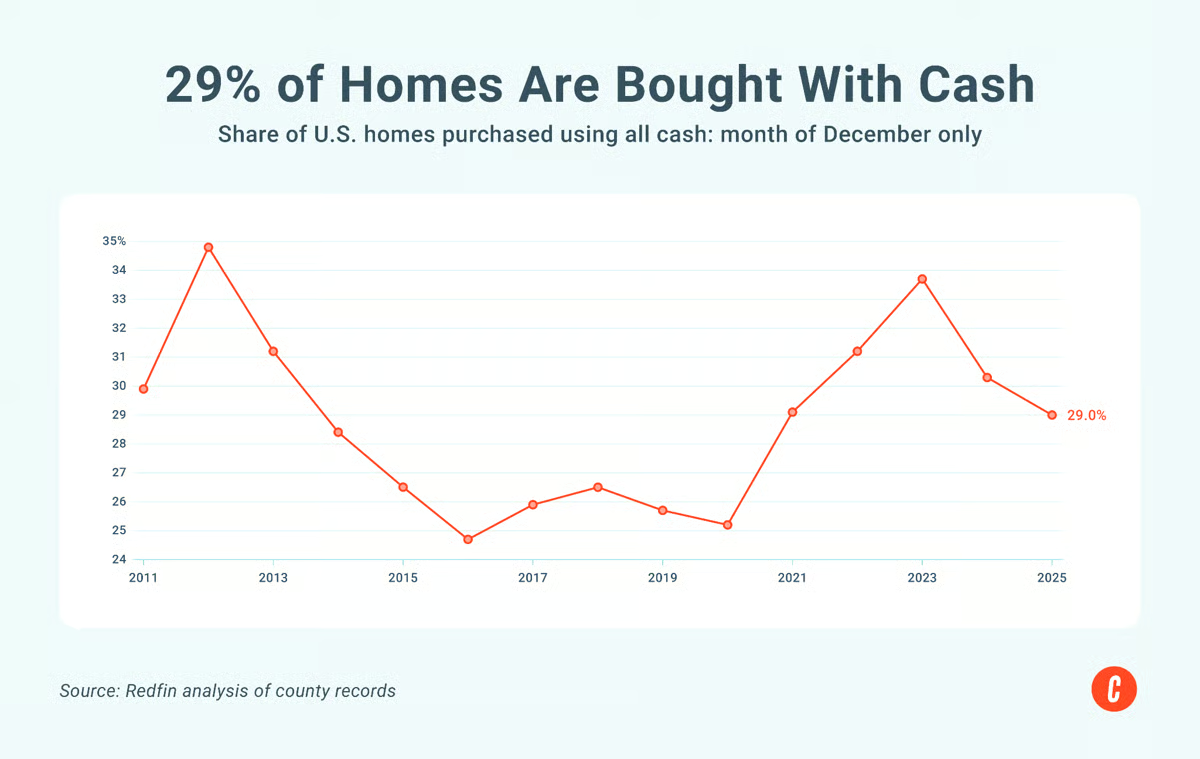
While cash still offers advantages, especially in markets where homes sit longer, buyers today have more flexibility than they did during the pandemic frenzy. The data also reinforces that affordability challenges continue to impact entry-level and FHA buyers, many of whom are struggling more with monthly payments, taxes, insurance, and closing costs than with just the down payment itself.
16. Wealthy Americans are allocating less of their portfolio to real estate
While affluent buyers are still active in luxury real estate, the share of wealth tied up in property has fallen as stocks, private credit, and AI-related investments attract more capital. A new report found that real estate now accounts for just 17.1% of total assets among the wealthiest 10% of households, down from more than 20% just a few years ago. Analysts say this reflects a broader portfolio rebalancing rather than a collapse in confidence around luxury housing, with many high-net-worth investors prioritizing liquidity and higher-growth opportunities tied to technology and artificial intelligence.
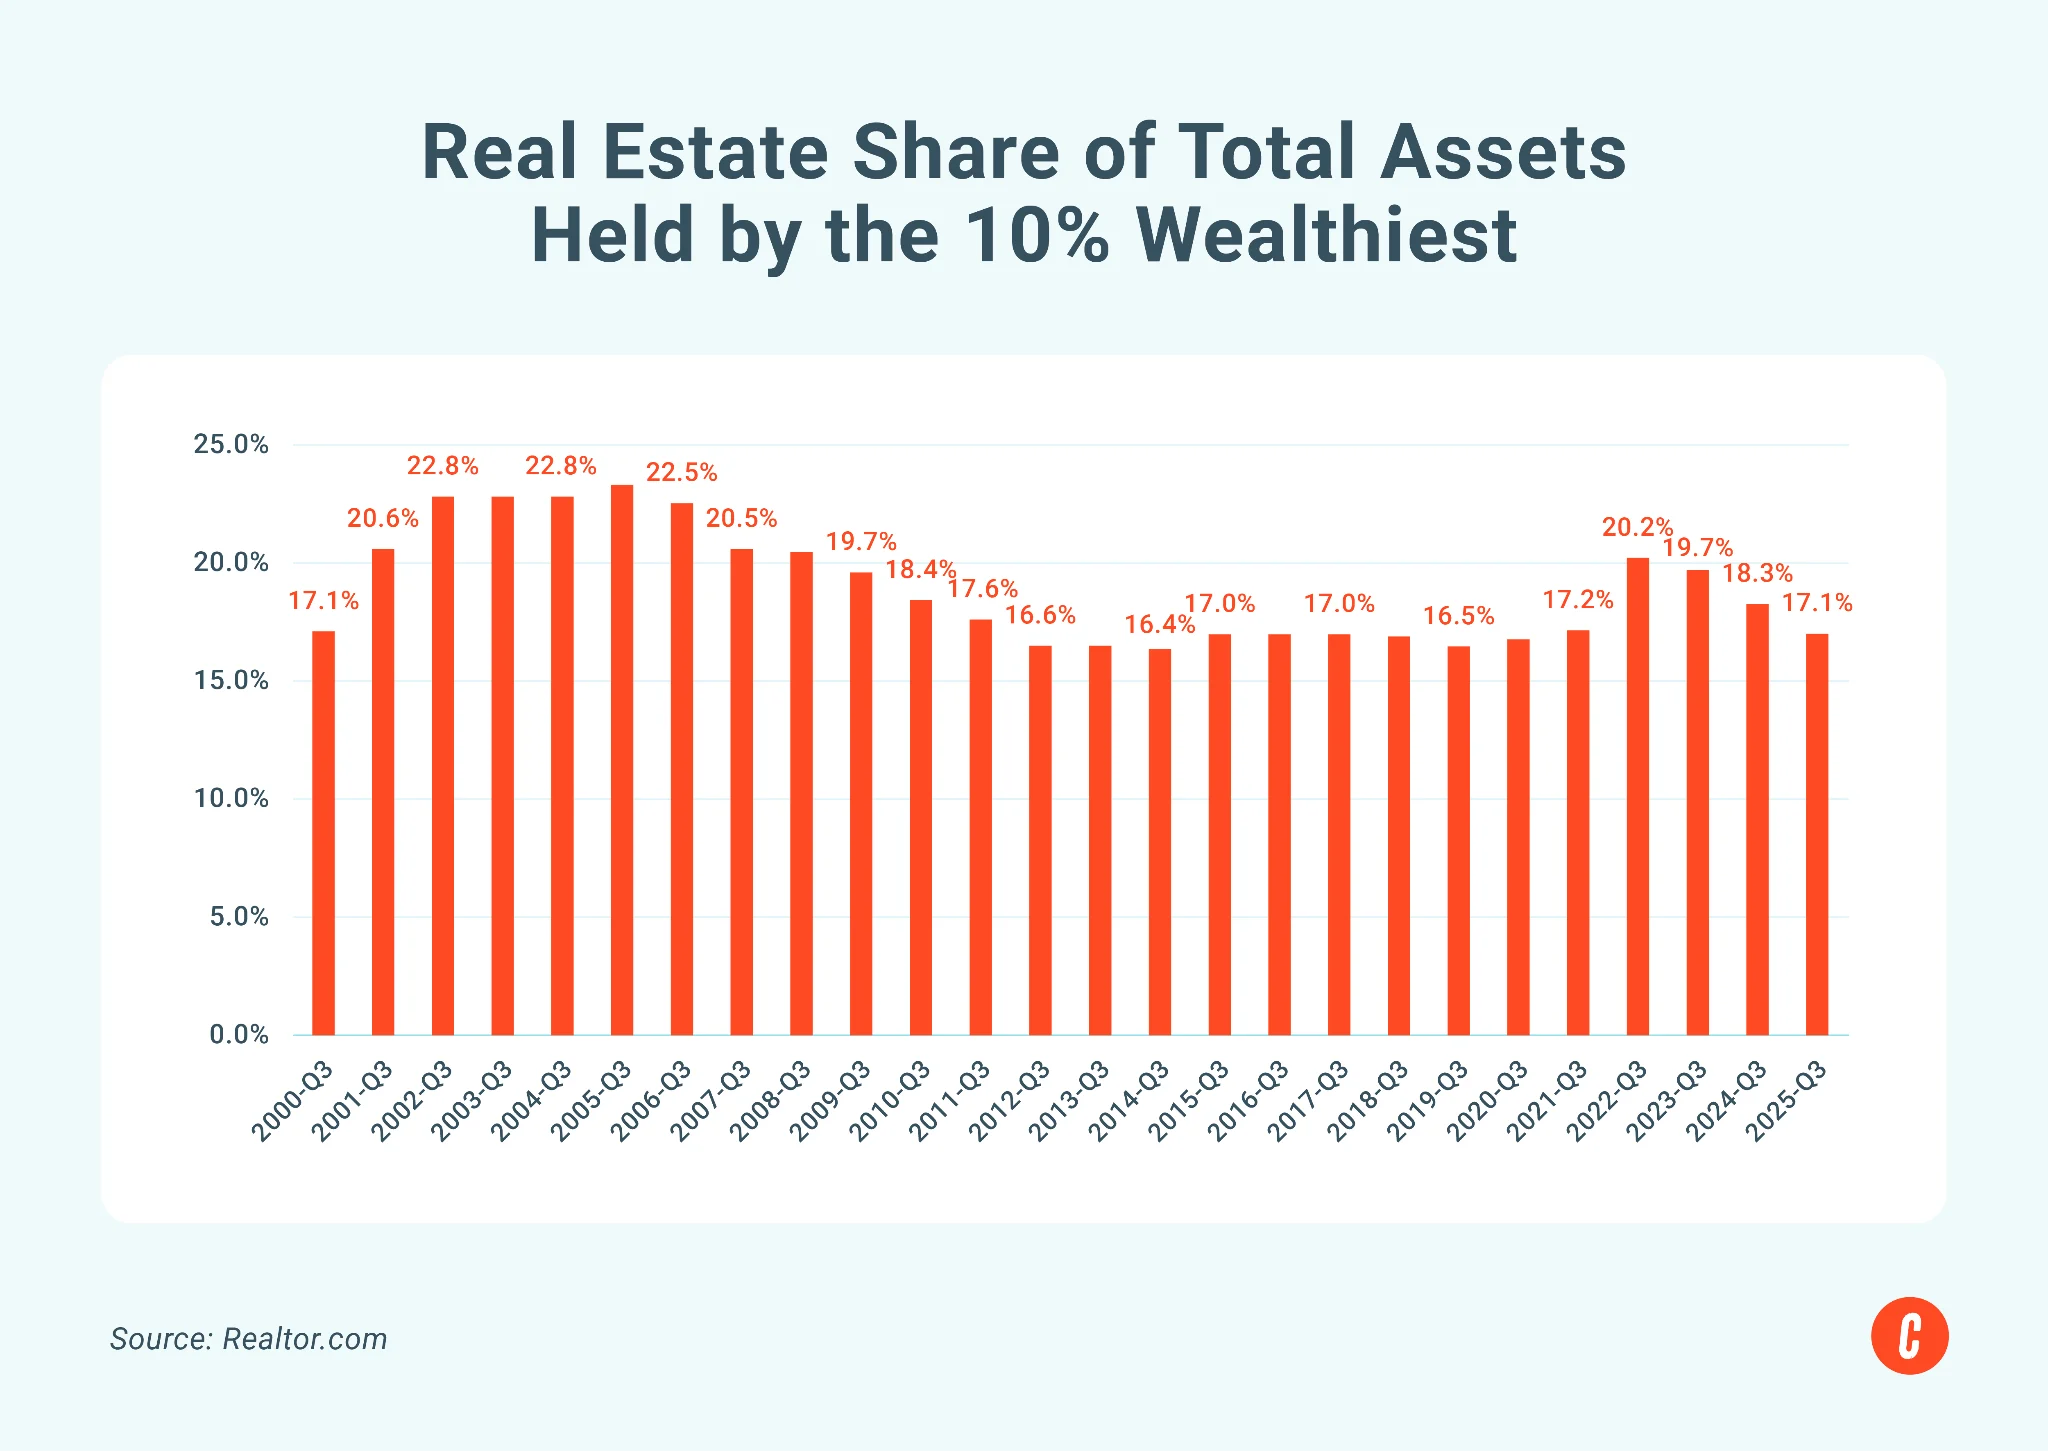
Luxury buyers are becoming more strategic and selective. Today’s affluent clients are increasingly evaluating homes through both lifestyle and investment lenses, weighing carrying costs and long-term value against alternative opportunities in financial markets. While speculative demand has cooled, many experts believe this is creating a healthier luxury market driven by buyers focused on generational wealth, stability, and quality assets rather than short-term appreciation.
17. Housing costs remain the biggest driver behind America’s affordability crisis
A new affordability report found Americans now need roughly $15,400 more per year to maintain the same standard of living they had in 2019, with housing costs leading the surge. While expenses like groceries, insurance, and childcare all climbed sharply, shelter and utilities rose nearly 34% nationally and remain the single largest household expense. States with the steepest affordability declines were largely concentrated in high-cost housing markets where inventory shortages and limited construction continue to pressure household budgets.
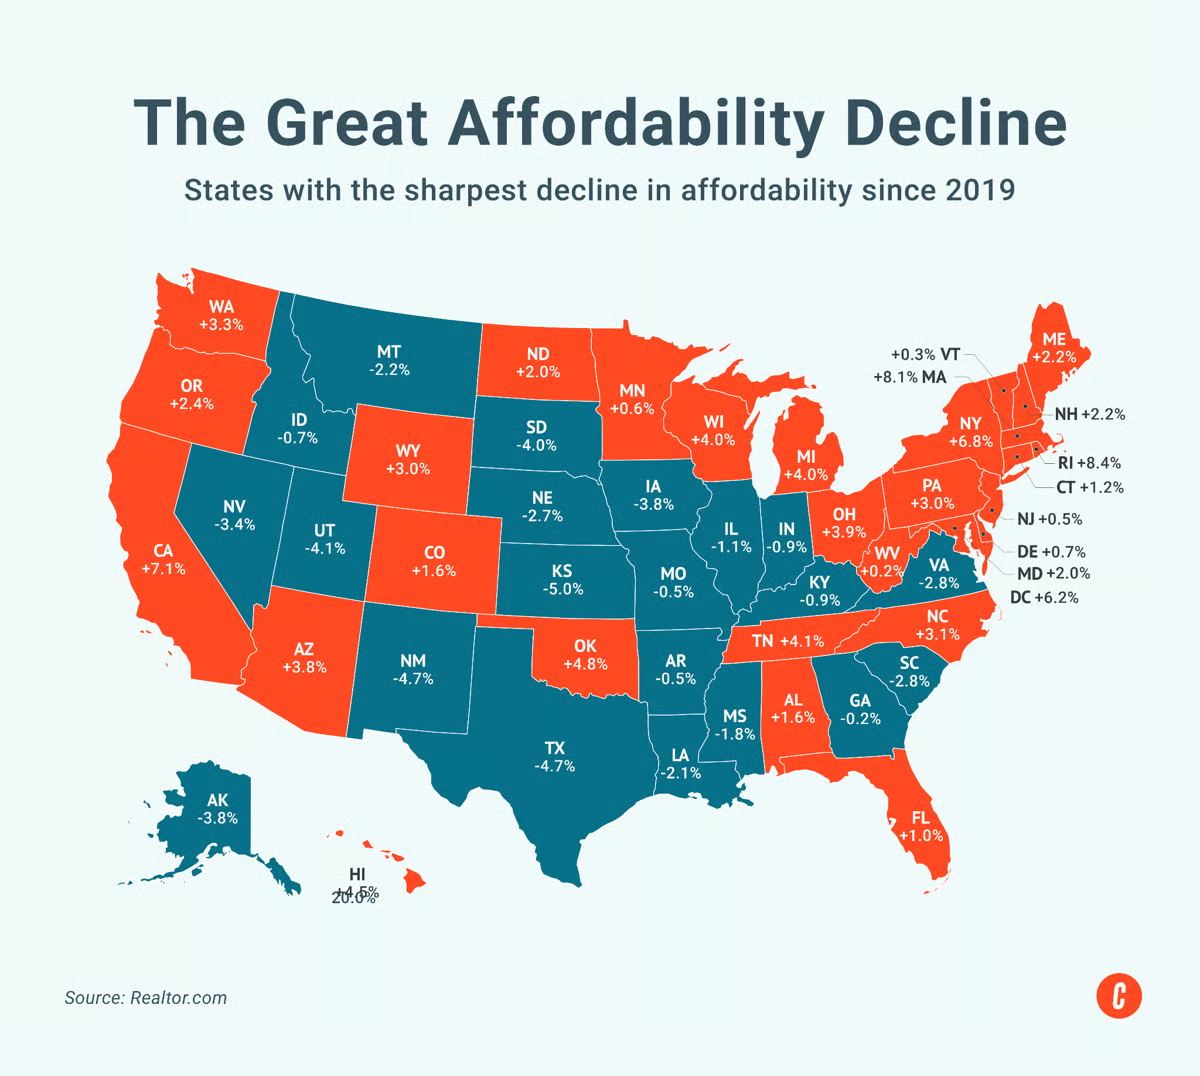
Data reinforces that affordability conversations now go far beyond mortgage rates alone. Buyers are increasingly evaluating total monthly living costs, including taxes, utilities, insurance, and childcare, when deciding where and whether to move. Markets that have added more housing supply have generally held up better, highlighting the growing importance of inventory in the long-term affordability conversation.
18. Homeowners hold dramatically more wealth than renters
One of the biggest financial advantages of homeownership is wealth building through equity and appreciation. In 2022, the median homeowner’s net worth was 38 times higher than that of renters, according to Federal Reserve data. The report explains that homeowners build wealth by paying down mortgage principal over time while also benefiting from rising home values, creating long-term financial gains that renters typically don’t capture.
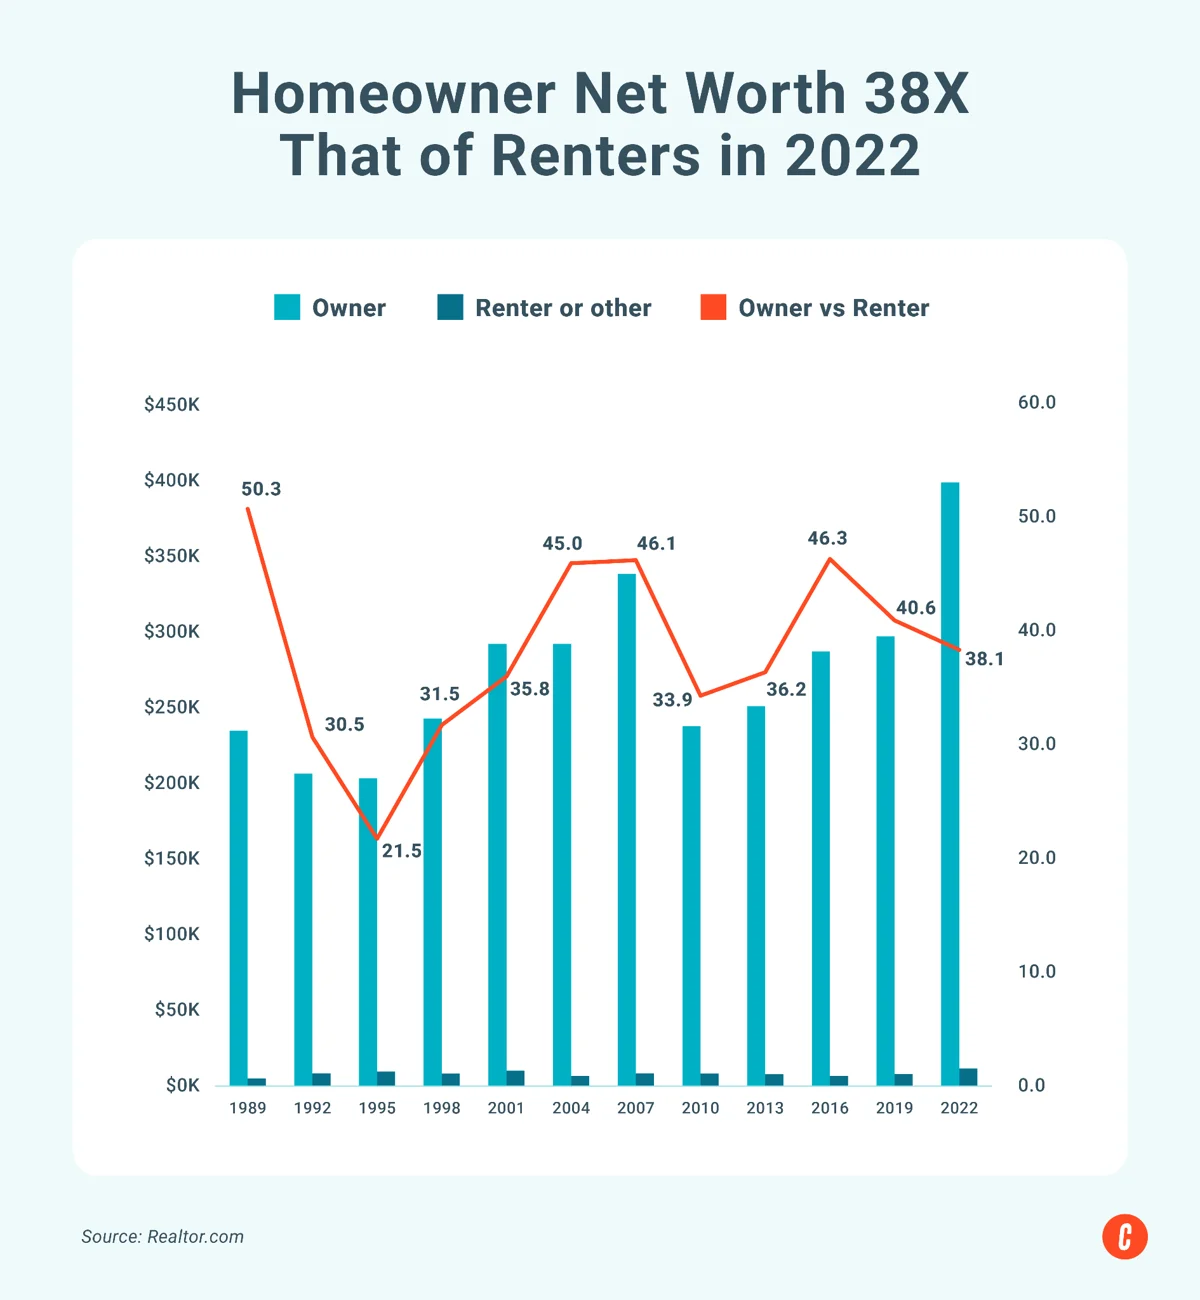
The earlier buyers enter the market, the longer they have for equity and appreciation to compound. But rising home prices and shrinking starter-home inventory are making it hard for many first-time buyers to access those long-term-wealth-building benefits, creating a growing divide between owners and renters.
19. Major short-term rental income opportunities
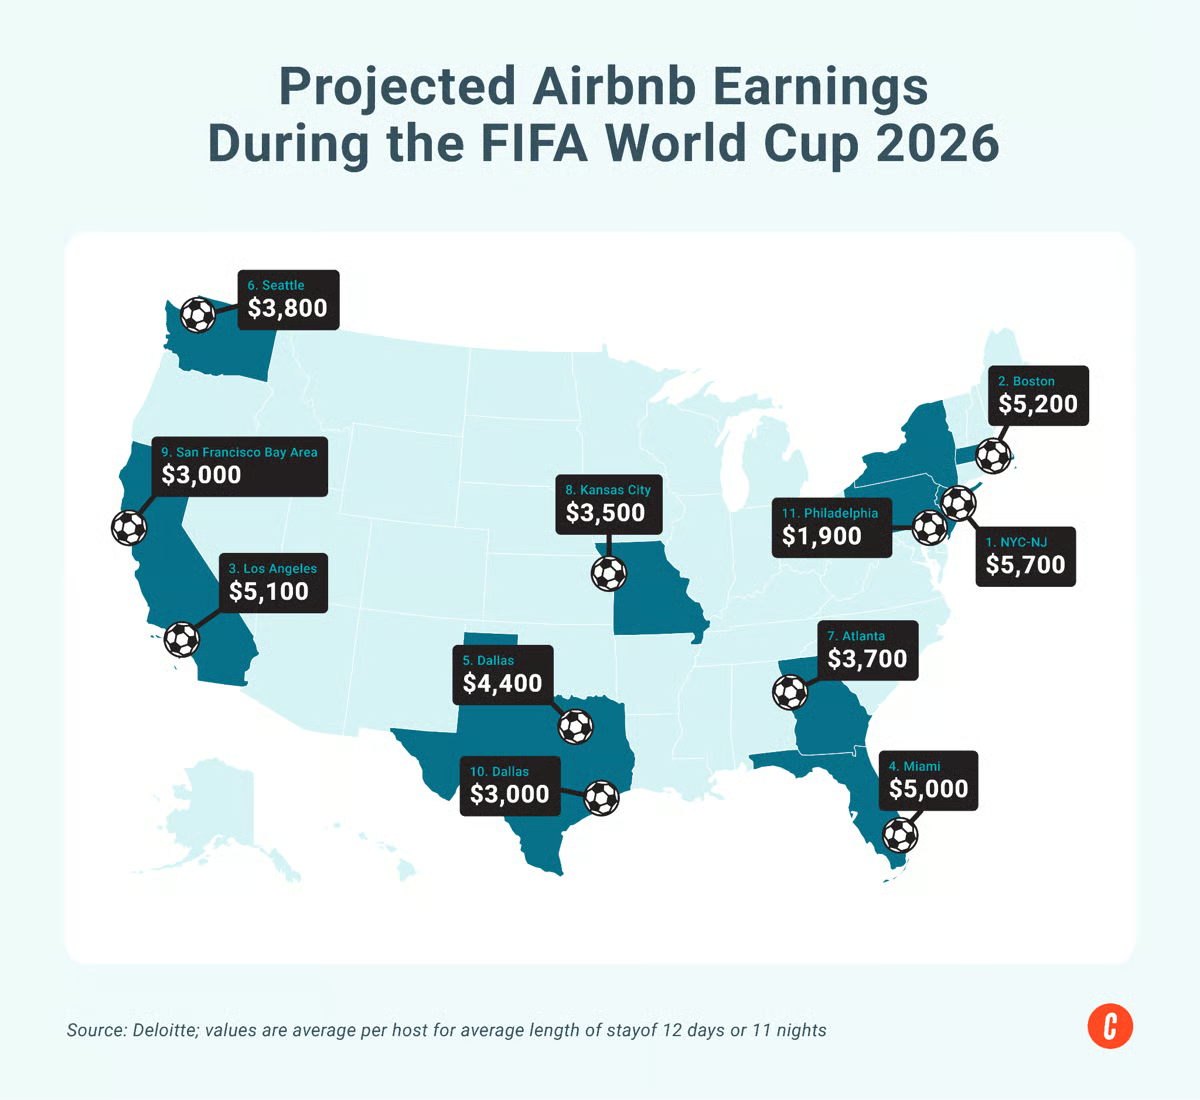
With an estimated 10 million visitors expected across host cities during the 2026 FIFA World Cup, short-term rental demand is projected to surge in major markets tied to the tournament. Airbnb earnings are expected to spike across many host cities, highlighting how global events can create major revenue opportunities for property owners and investors.
For investors, the high expected earnings reinforce the income potential tied to short-term rentals in high-demand event markets. Large-scale events like the World Cup can significantly increase occupancy rates, nightly pricing, and overall cash flow, making event-driven rental markets especially attractive for investment strategies.
20. Small home projects can deliver some of the biggest returns on investment
As sellers prepare to list in a more competitive market, smaller home updates are proving to deliver some of the strongest returns. Many of the top-performing improvements focus on curb appeal and simple cosmetic upgrades rather than large-scale renovations, showing that sellers don’t necessarily need major remodels to add value before listing.
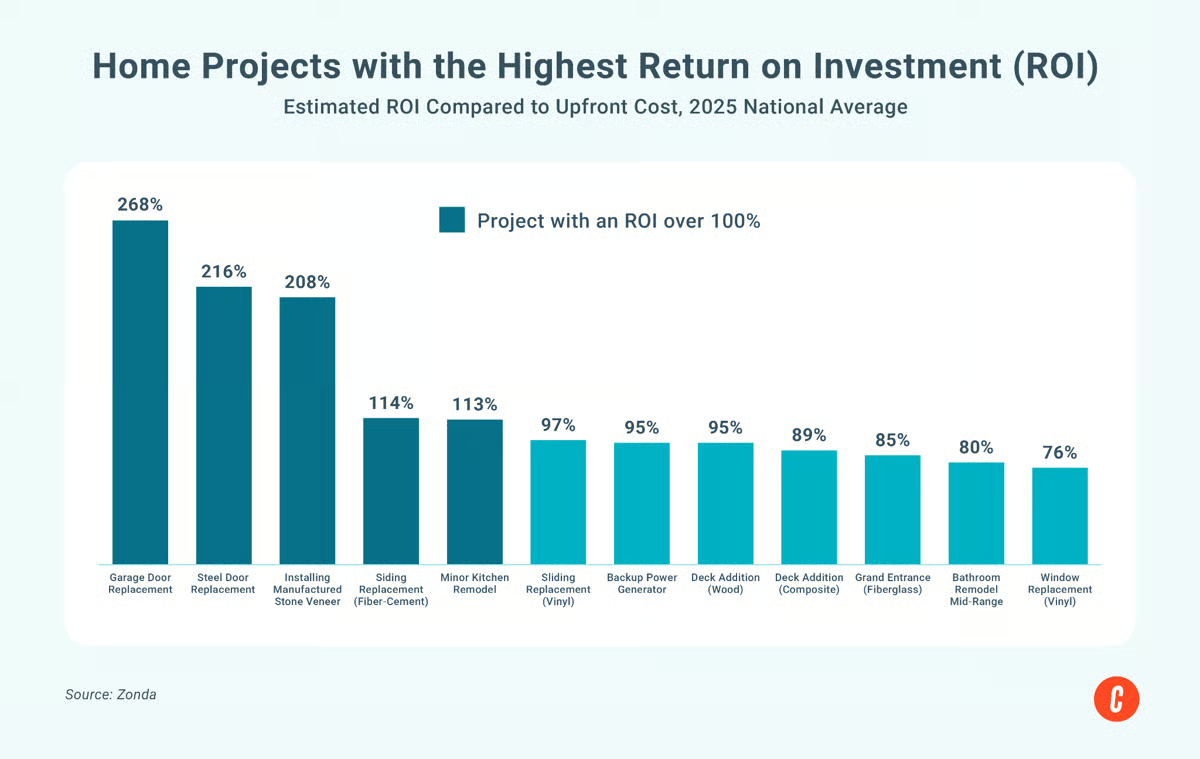
For agents and homeowners, the takeaway is that move-in-ready homes still hold a strong advantage with buyers. Smaller projects like fresh paint, updated lighting and hardware, landscaping, or entryway improvements can help stand out and create stronger first impressions without the cost of a full renovation.
Frequently asked questions (FAQs)
Even though mortgage rates have eased slightly from recent highs, home prices, insurance costs, taxes, and everyday living expenses remain elevated. Many buyers are struggling more with monthly payments than just the purchase price alone.
Many buyers are prioritizing affordability, functionality, and flexible living spaces over sheer size. Smaller homes with efficient layouts, outdoor space, and move-in-ready features are becoming increasingly desirable.
The market is becoming more balanced compared to the pandemic years. In many areas, buyers now have more negotiating power as inventory increases and homes take longer to sell, though conditions still vary heavily by local market.
Your take
As a real estate agent myself, I know how quickly this market can shift and how important it is to stay ahead of changing trends, buyer behavior, and economic conditions. Today’s housing market is creating both challenges and opportunities, from affordability concerns and rising inventory to changing migration patterns and evolving consumer priorities. The agents who take the time to understand these shifts are the ones best positioned to educate clients, build trust, set realistic expectations, and ultimately stand out as true advisors in an increasingly competitive industry.
Related Articles