


Studies consistently show that when you add colorful infographics to text, your audience’s willingness to read your message increases substantially. Sounds like a perfect way to increase audience engagement with your real estate marketing, right? We think so too! 💯👍 This collection of helpful real estate infographics is designed to inspire you and covers topics for buyers, sellers, first-time homebuyers, and so much more.
We’ve also included a helpful guide to creating your own infographics, a list of tools and resources, customizable templates, plus some tips on how to share them to maximize engagement … and maybe even go viral.
- 65 Real Estate Infographics to Inspire
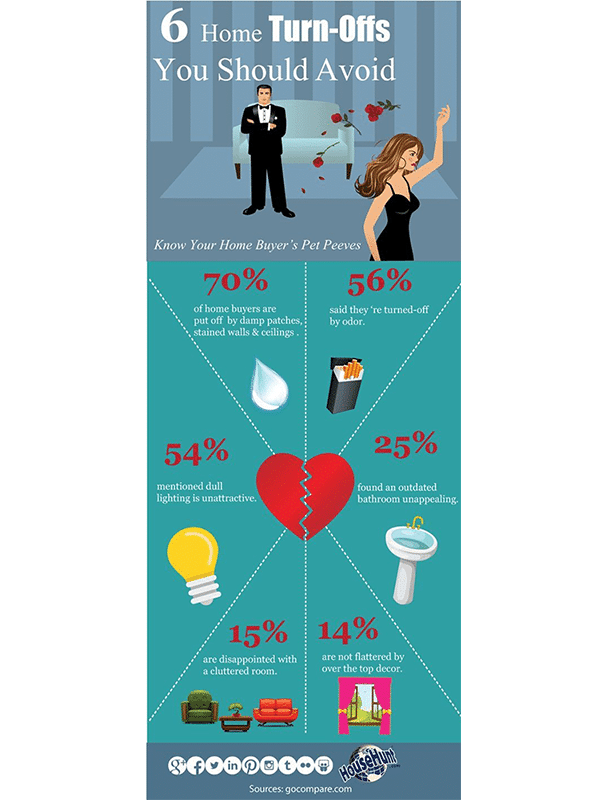
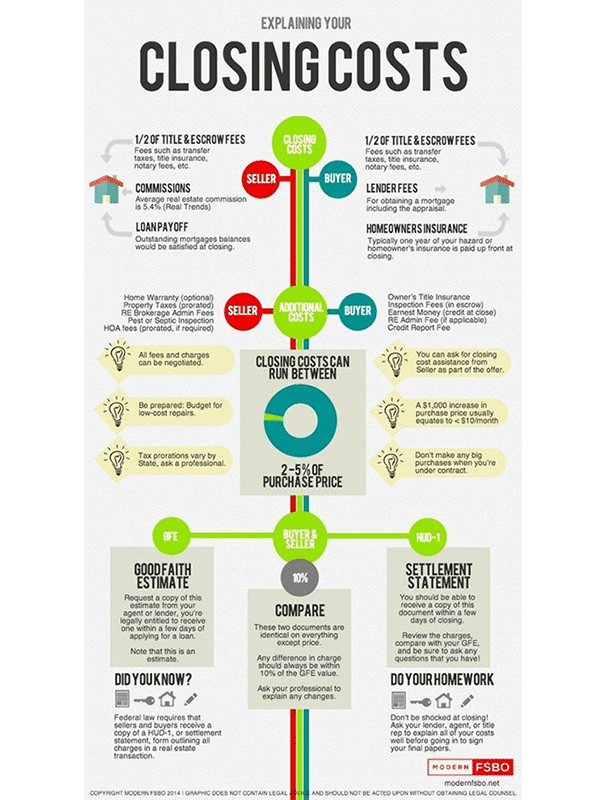
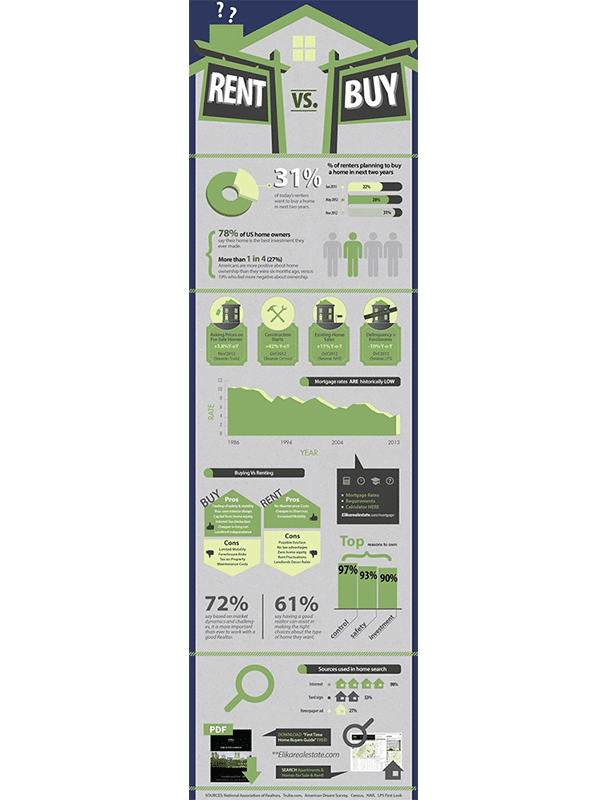
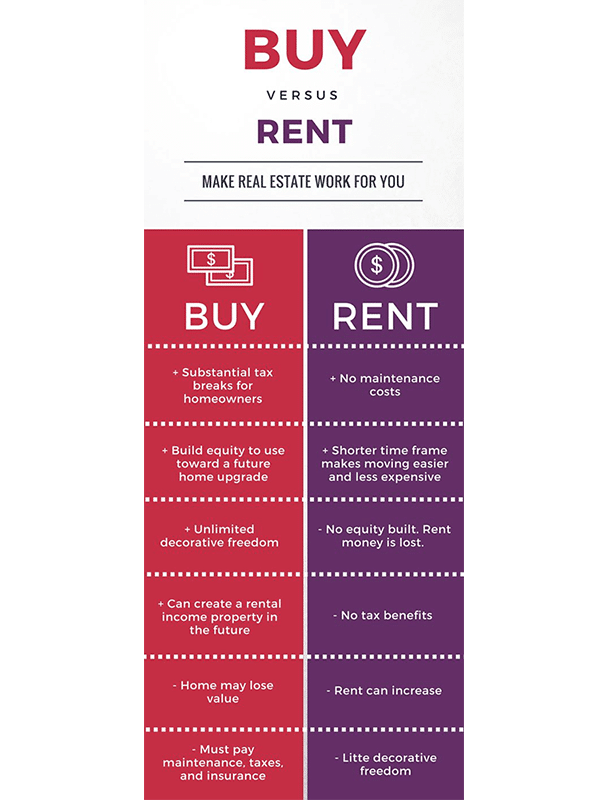
- 23 Infographics for Buyers
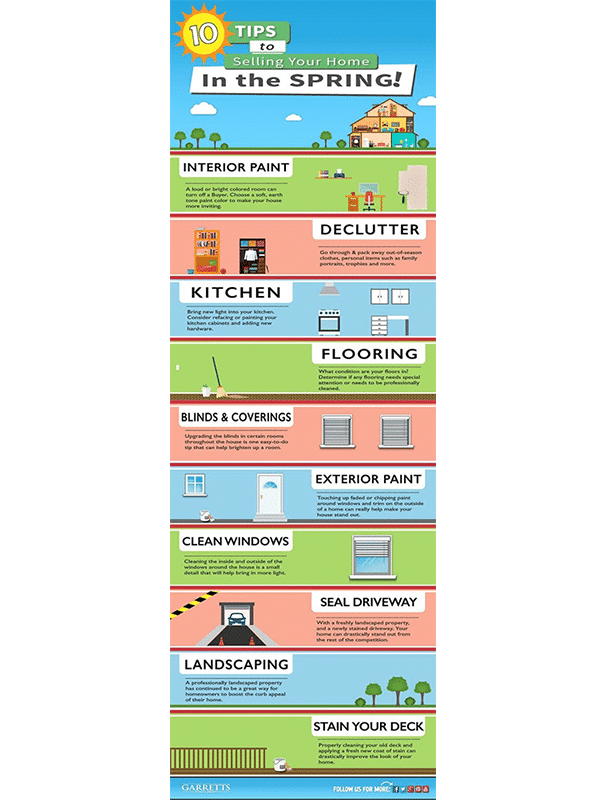
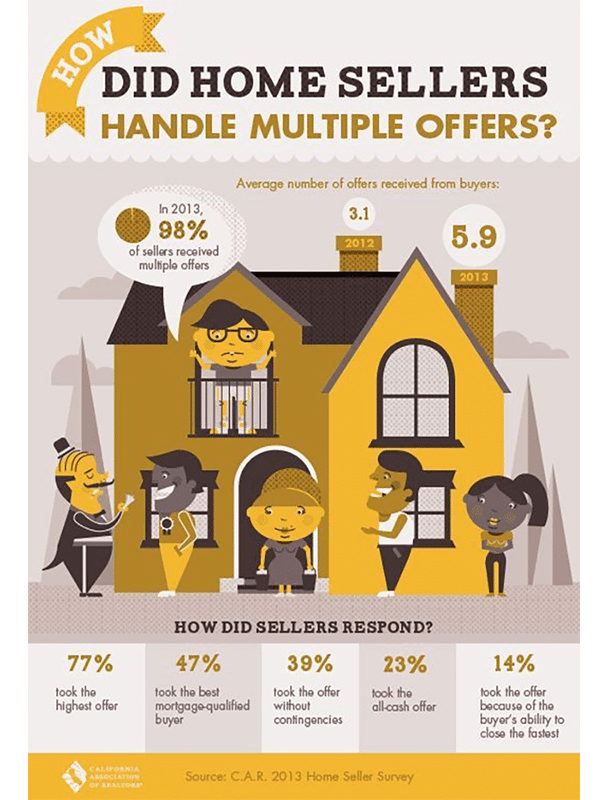
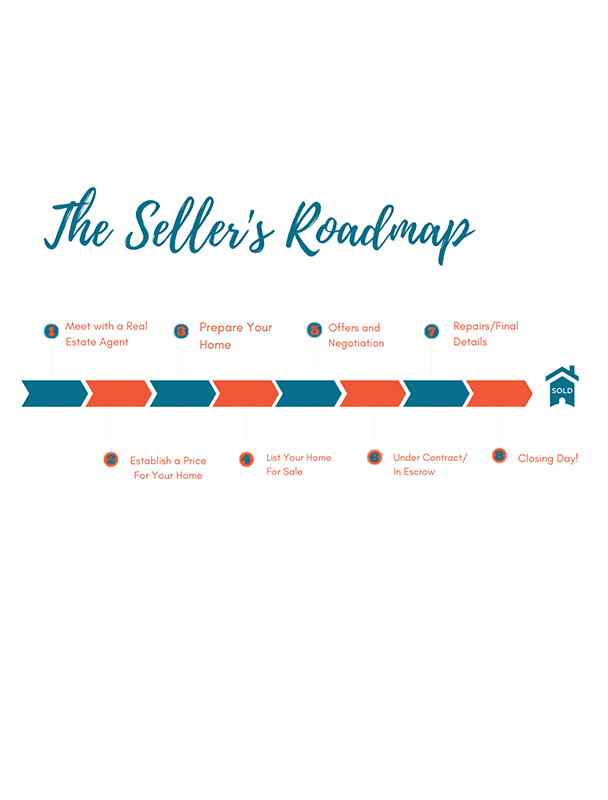
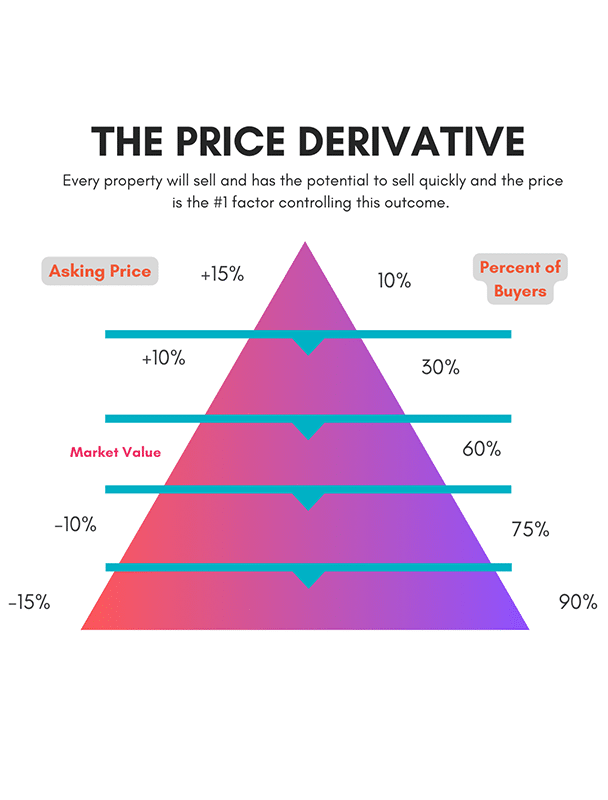
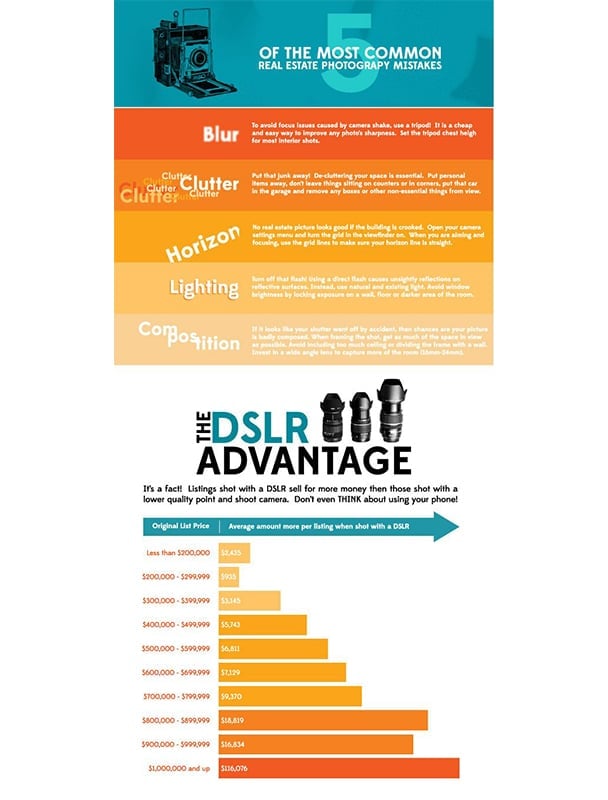
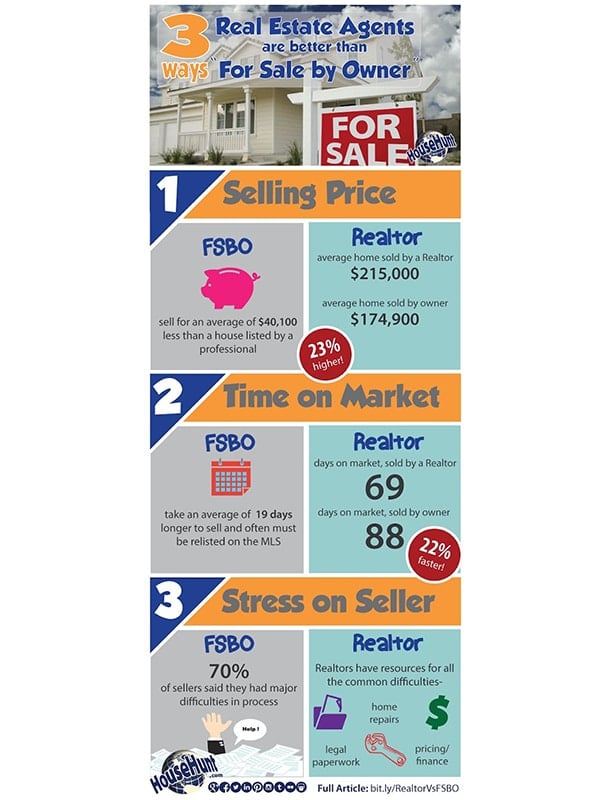
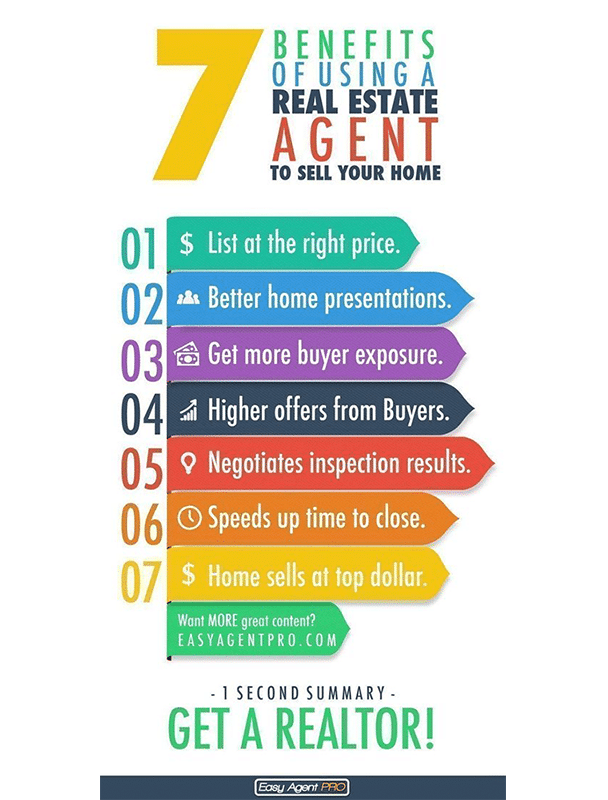
- 11 Infographics for Sellers
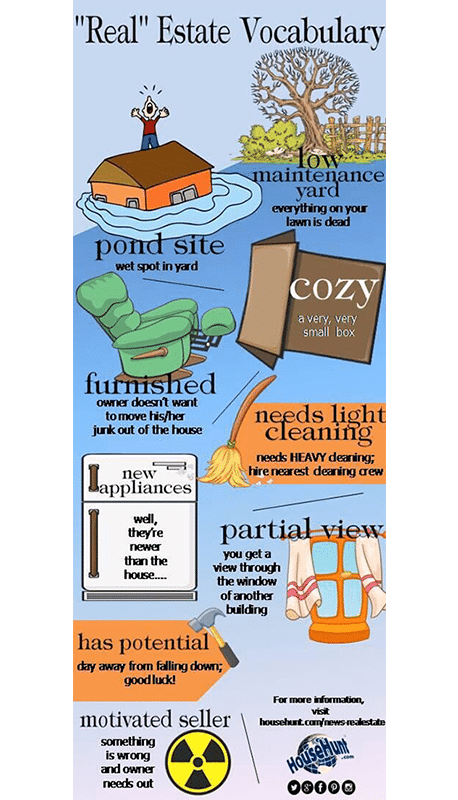
- 25 Infographics for Prospects & Leads
- 6 Infographics for Industry Pros
- Why You Should be Using Real Estate Infographics
- How to Create Real Estate Infographics Quickly & Easily
- Expert Tips for Making Great Infographics
- Infographic Templates for The Close Readers
- Where to Share Your Infographics for Maximum Impact
- Bringing It All Together
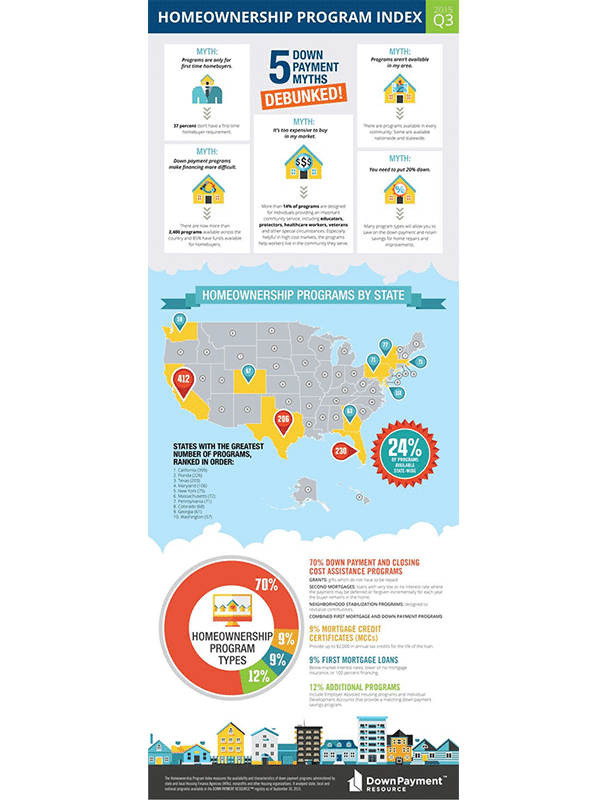
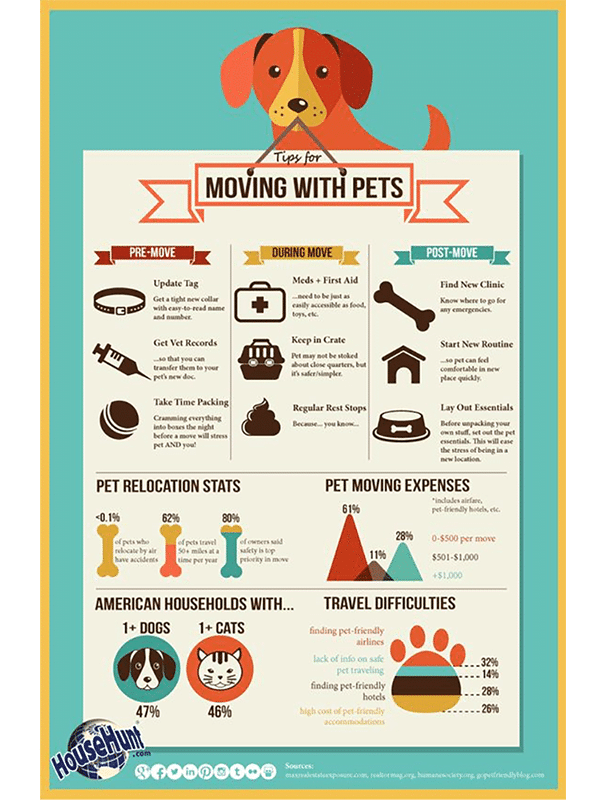
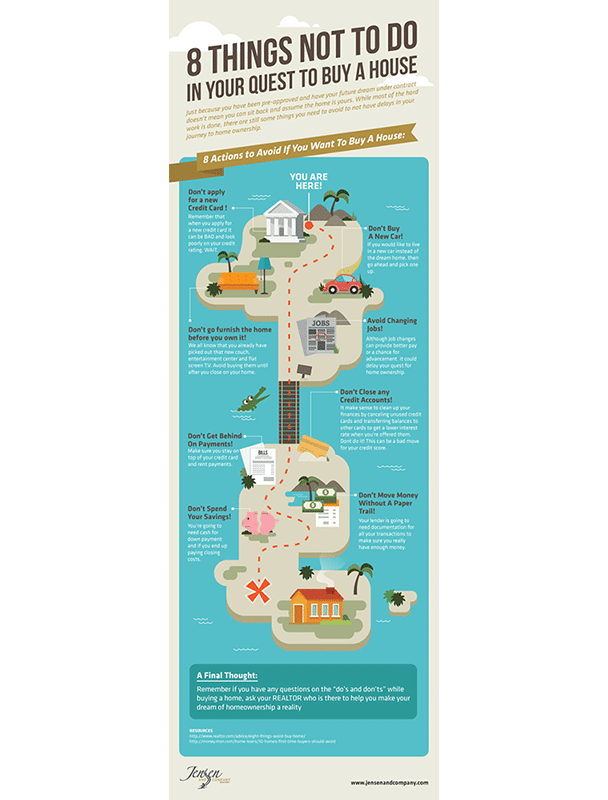
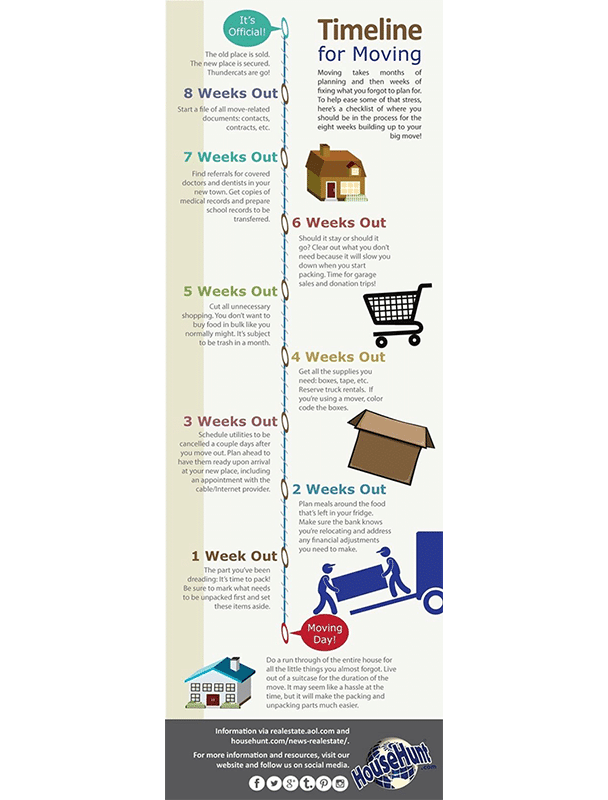
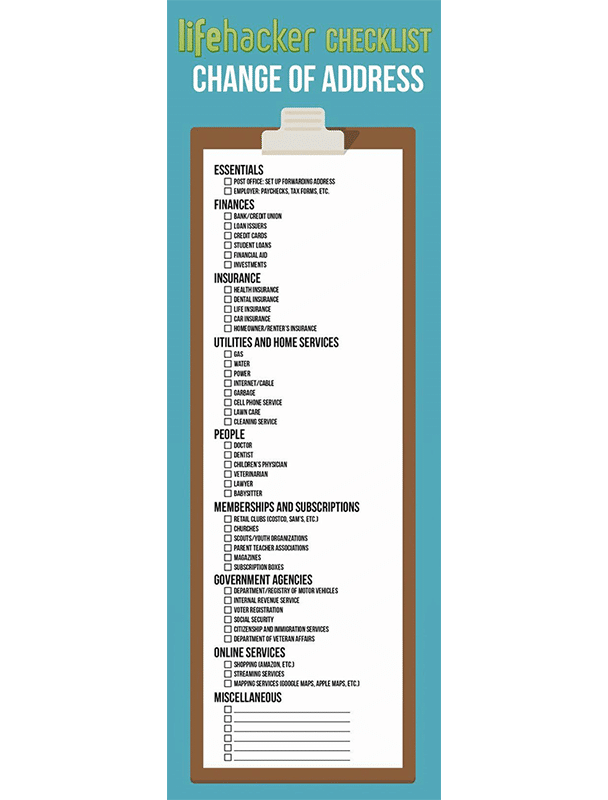
65 Real Estate Infographics to Inspire
This collection of favorite infographics is all about inspiration. But if you want to jump right in and create your own, check out our Canva templates, which are ready for your customizations and perfect for sharing with clients and leads in email, on your blog, or across your social media.
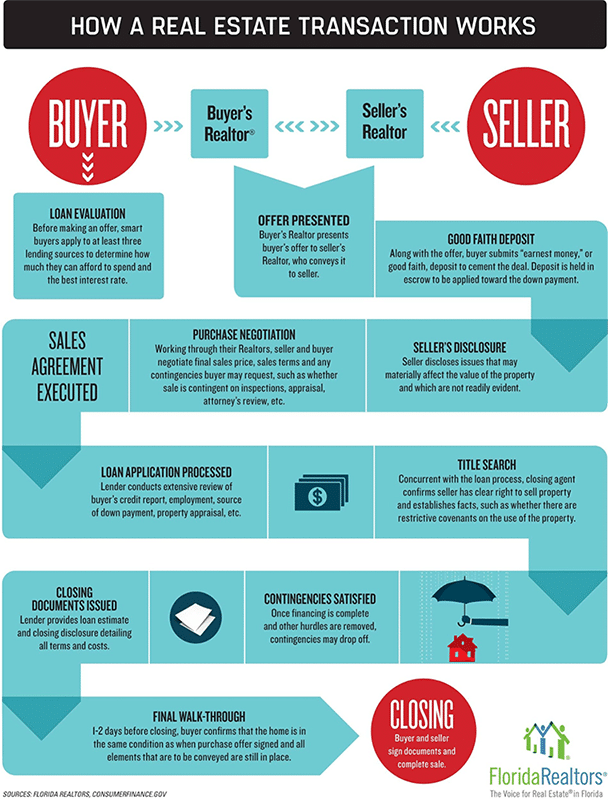
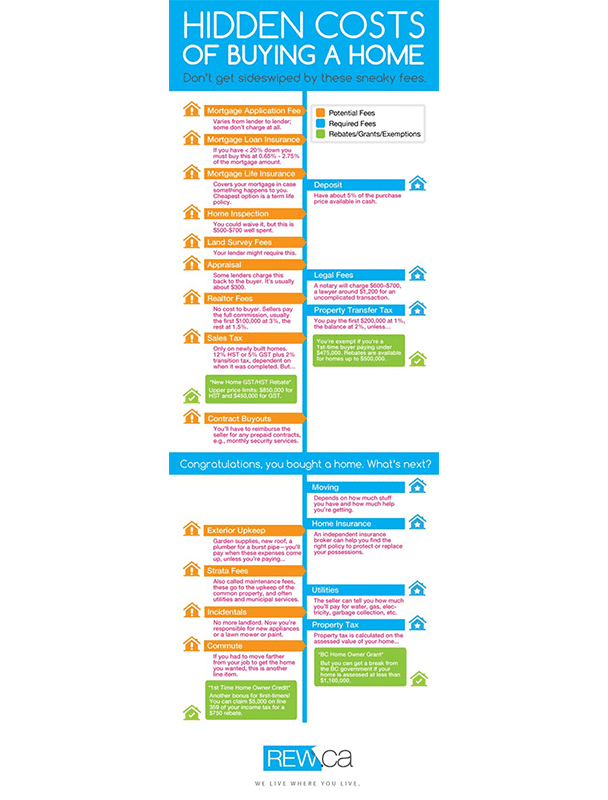
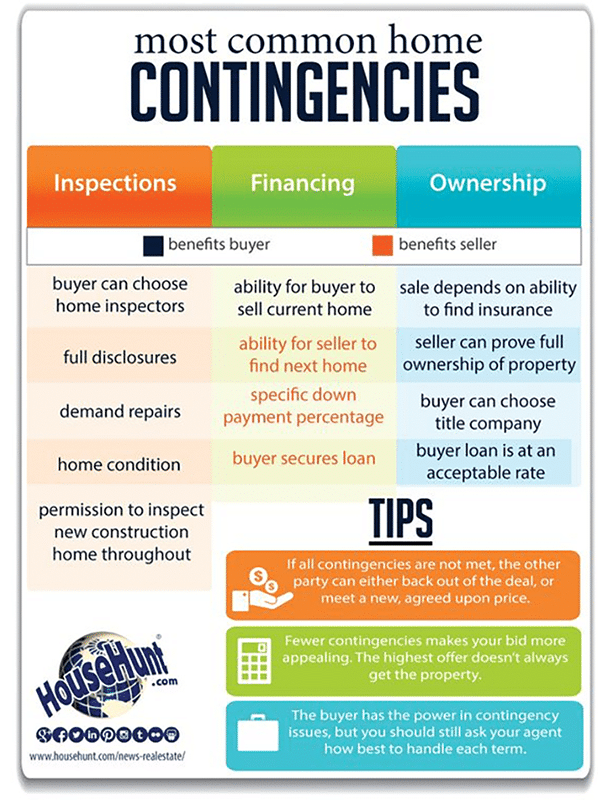
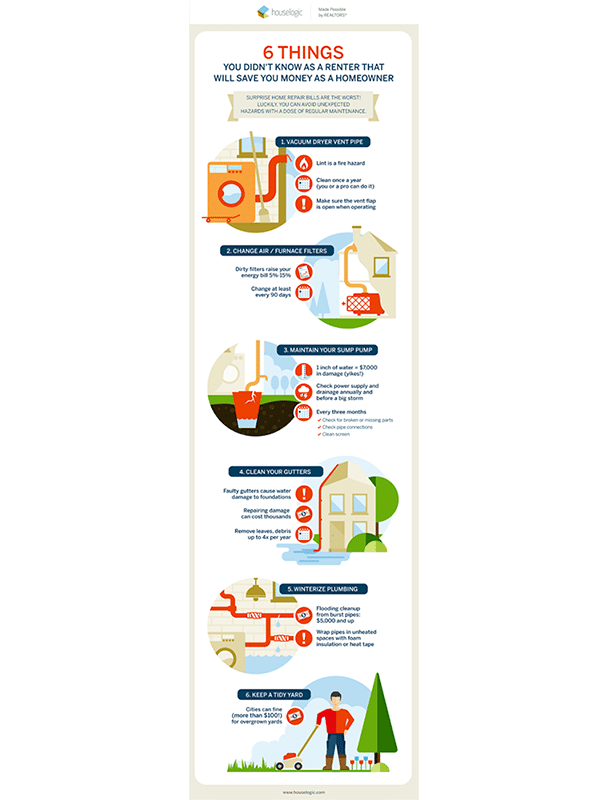
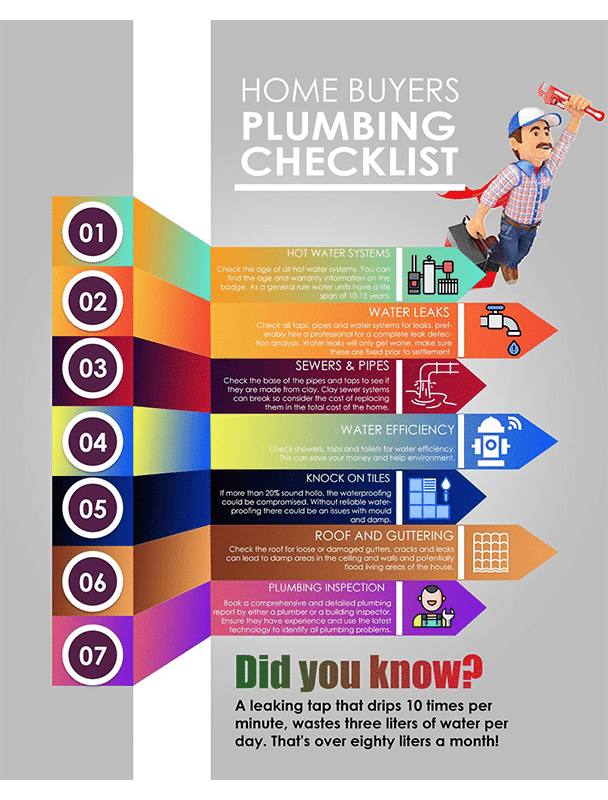
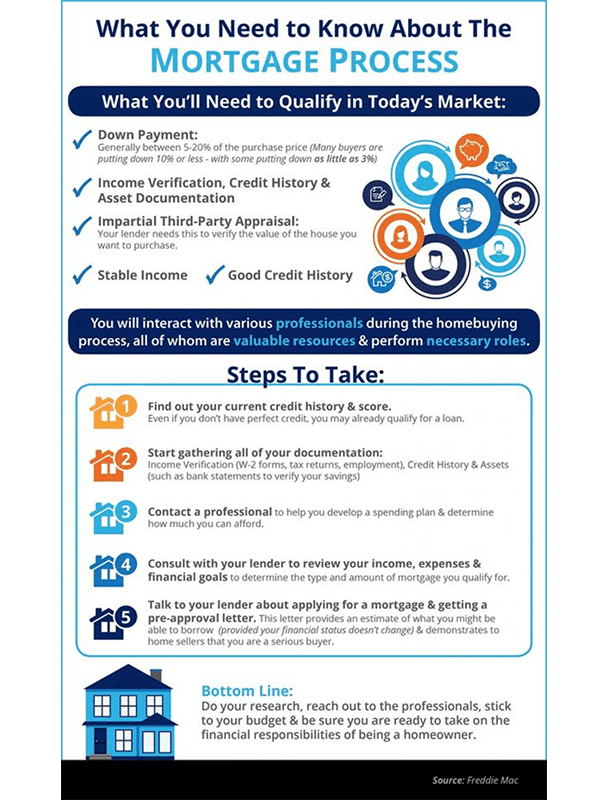
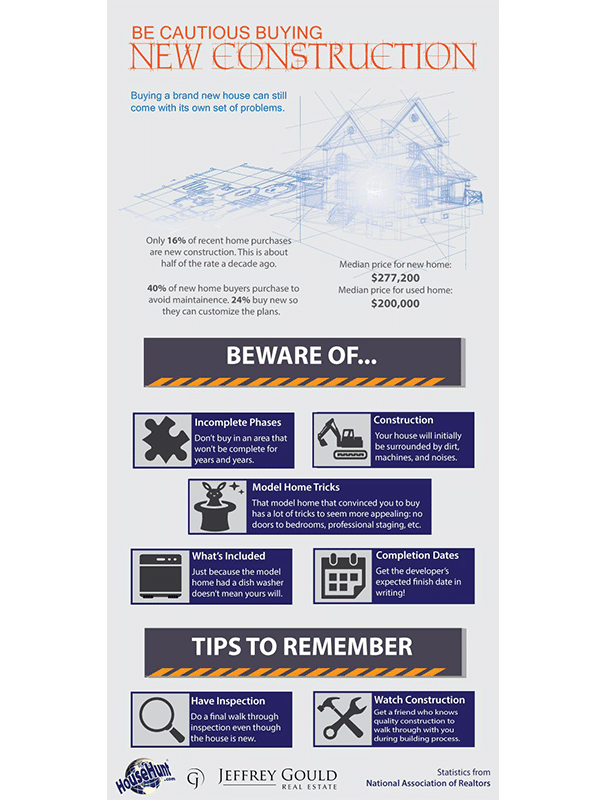
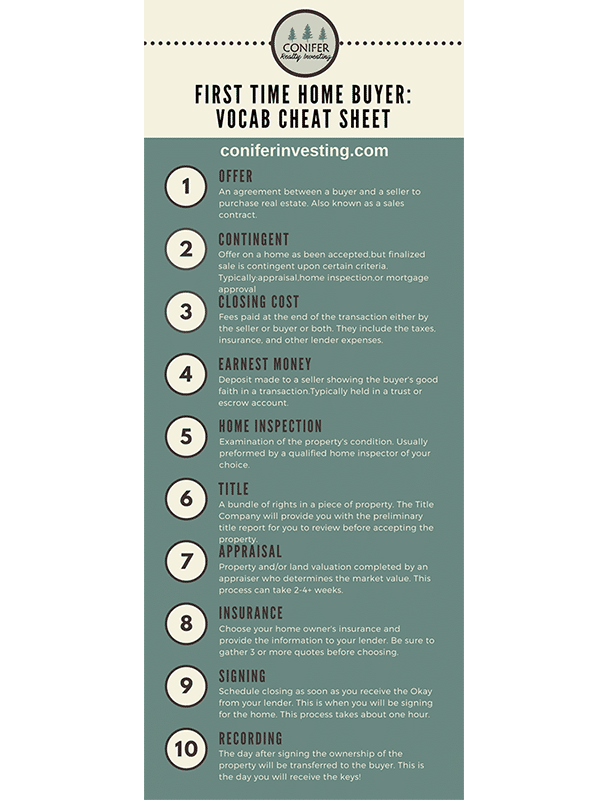
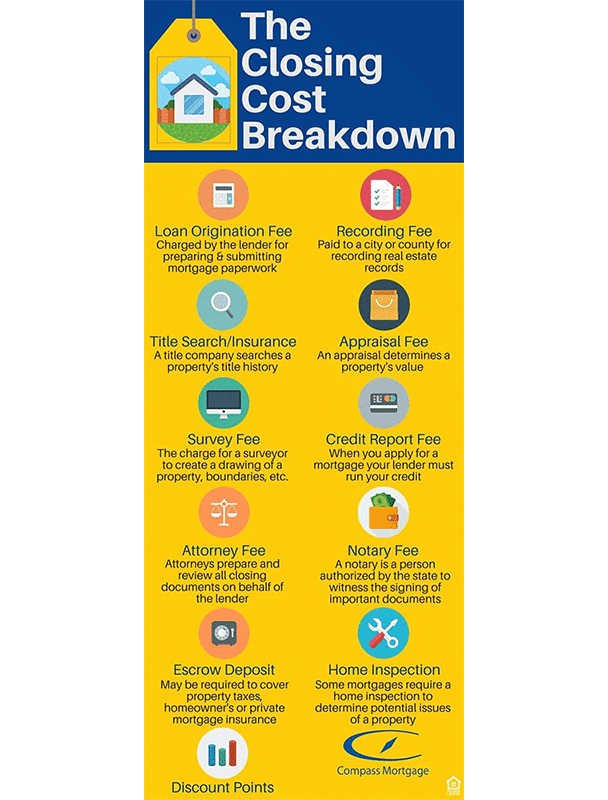
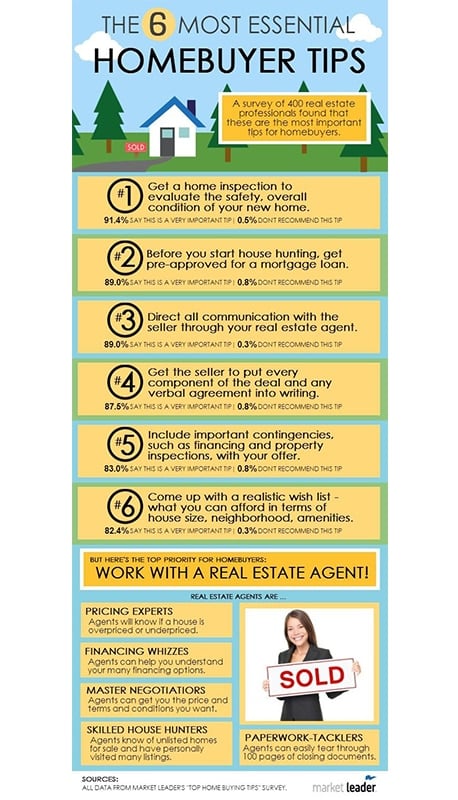
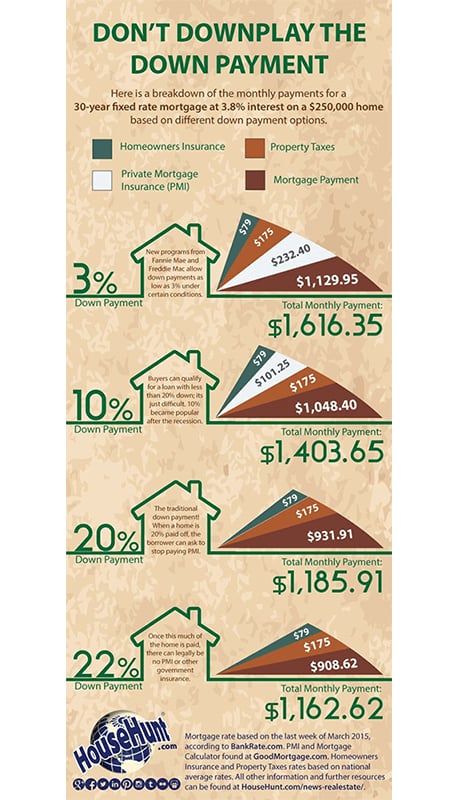
23 Infographics for Buyers


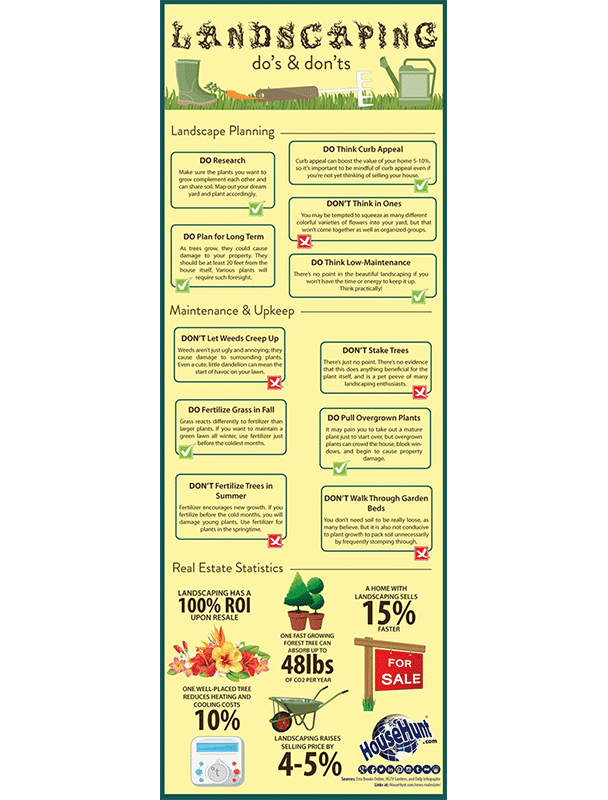
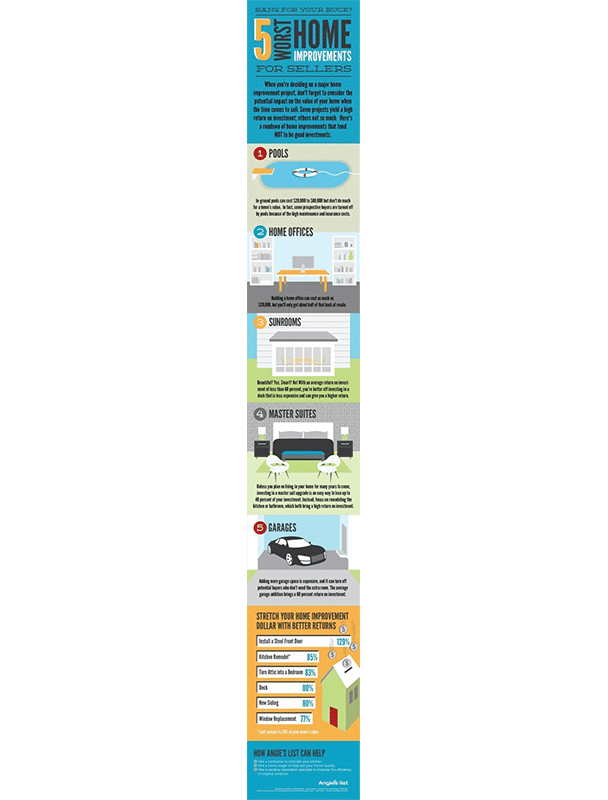
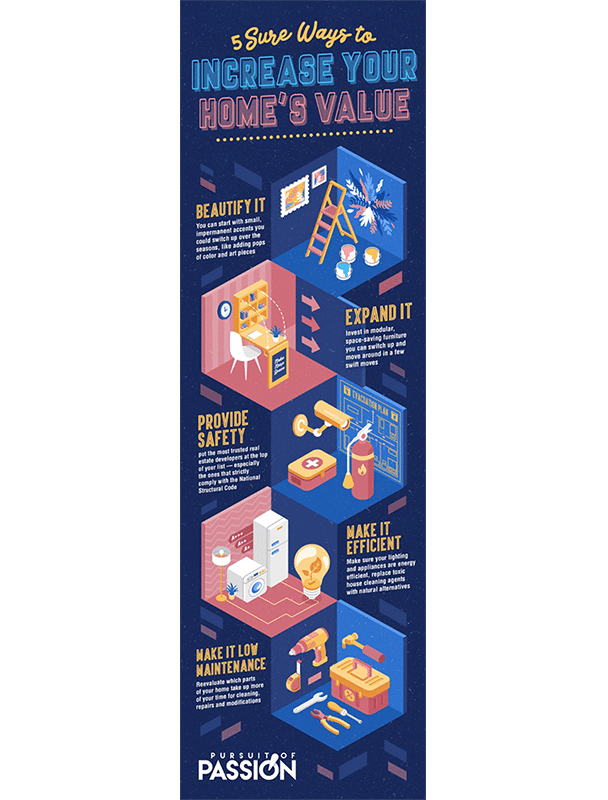
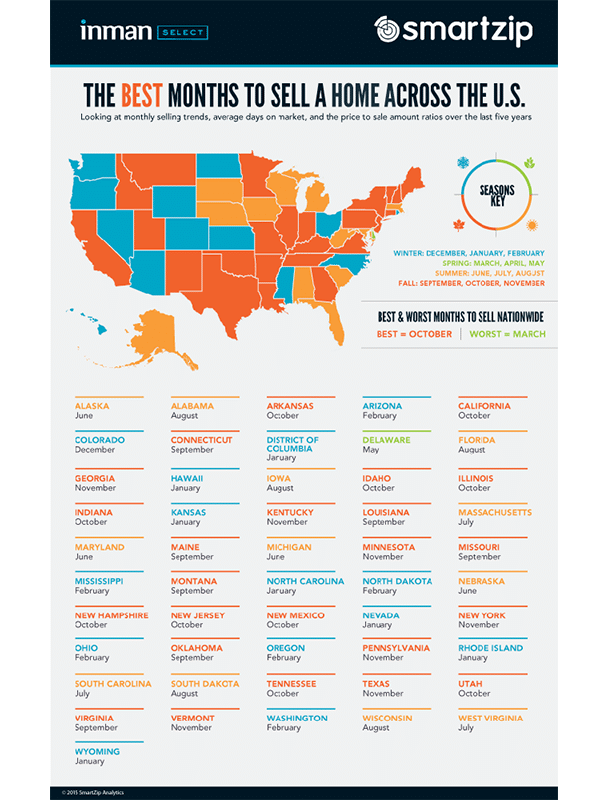
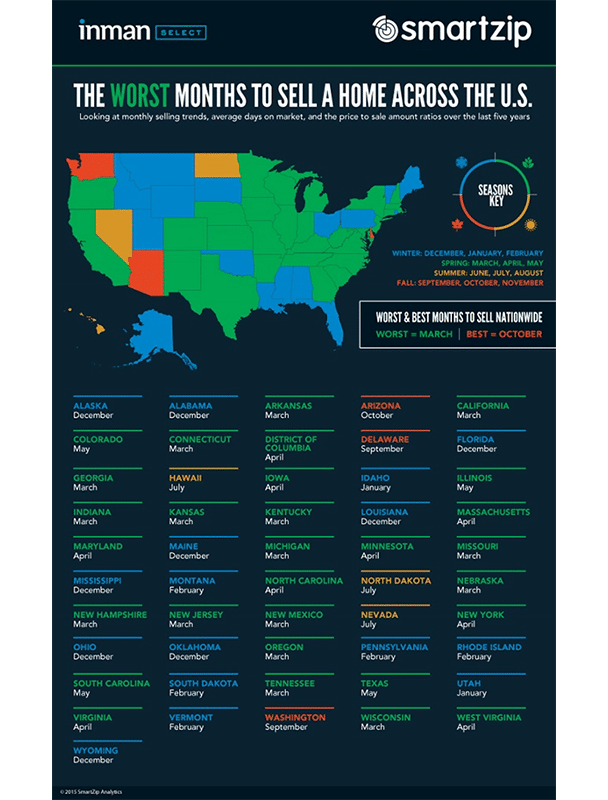
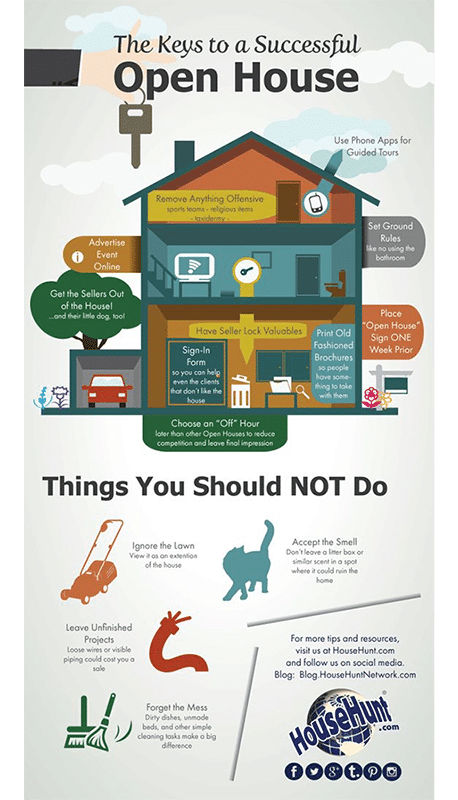
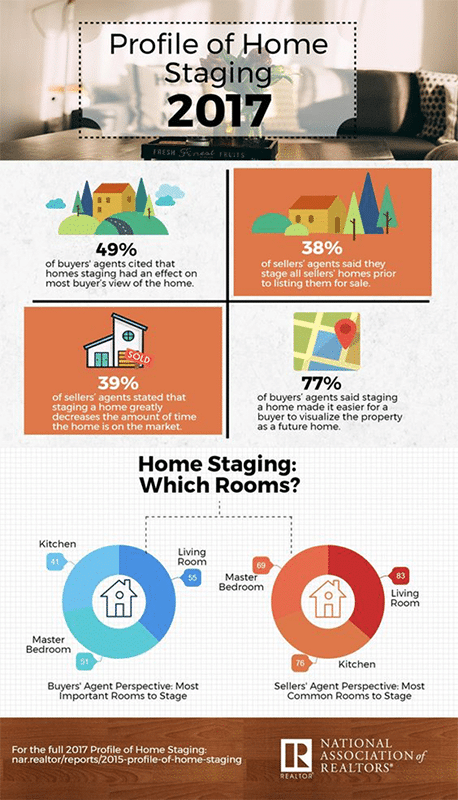
11 Infographics for Sellers


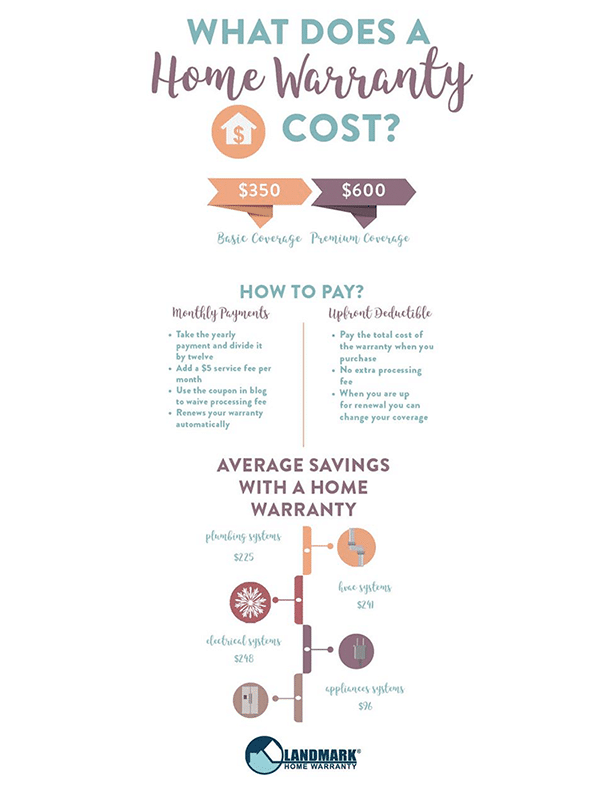
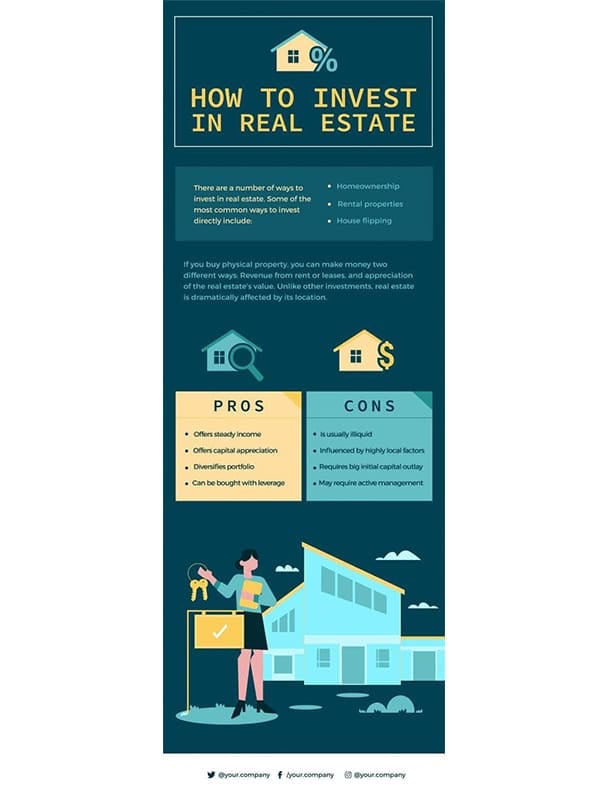
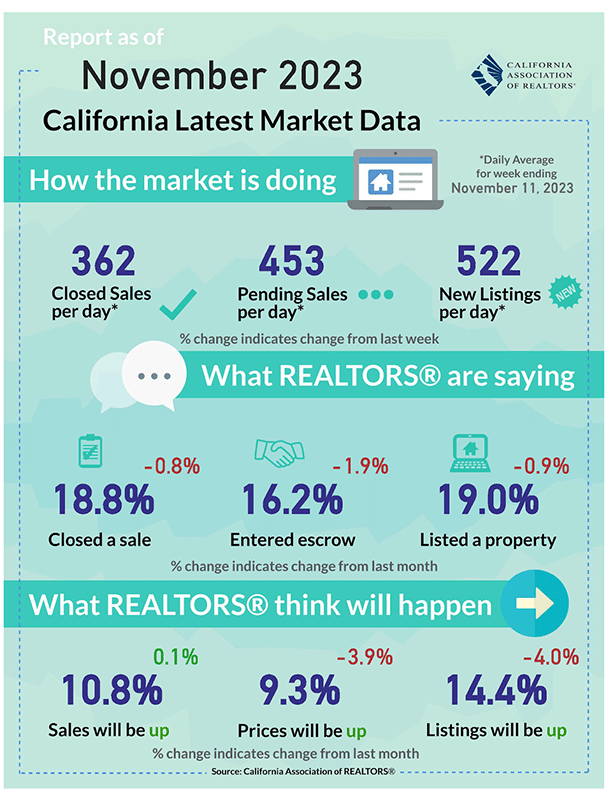
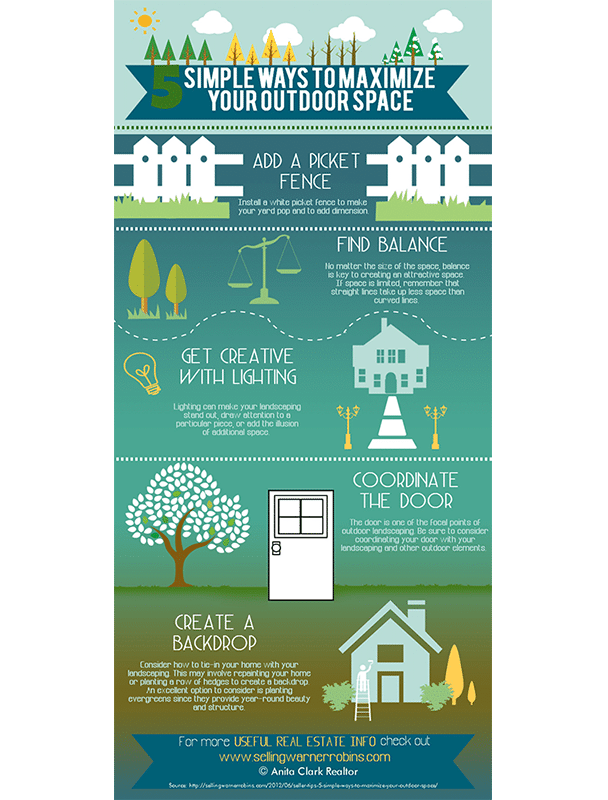
25 Infographics for Prospects & Leads


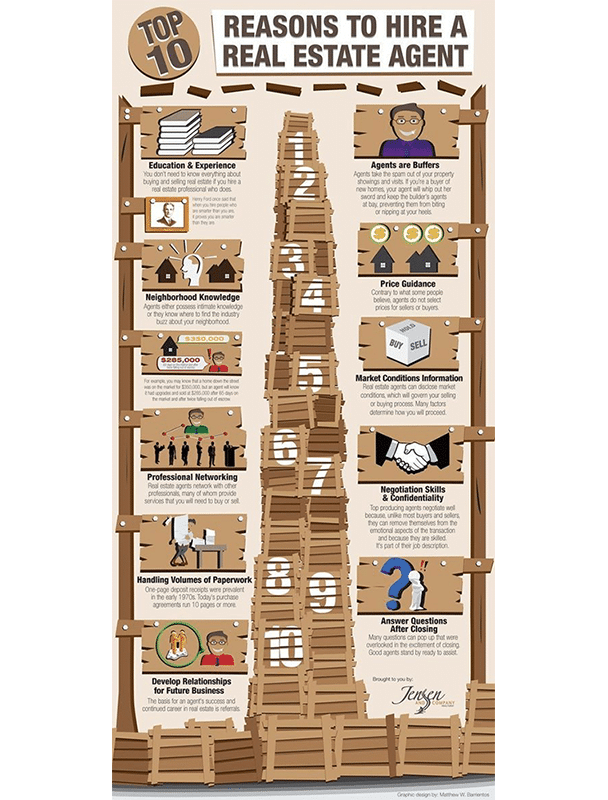


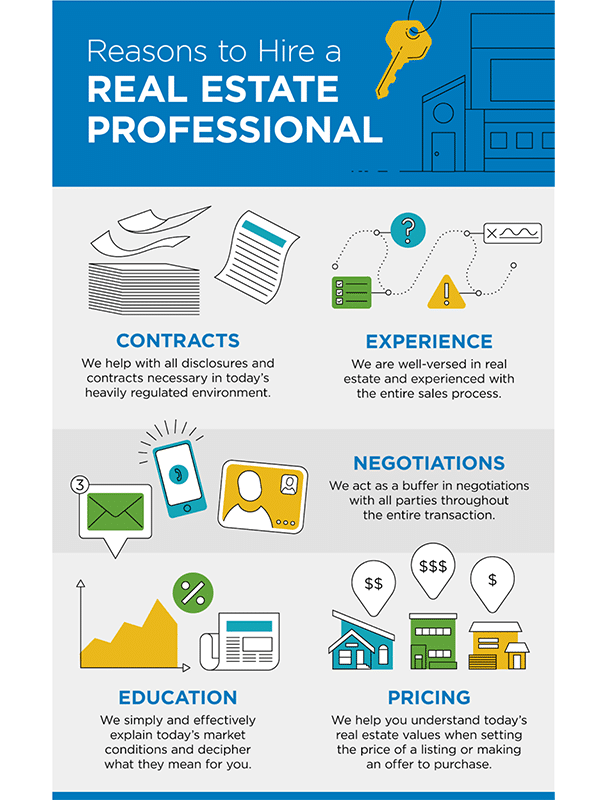


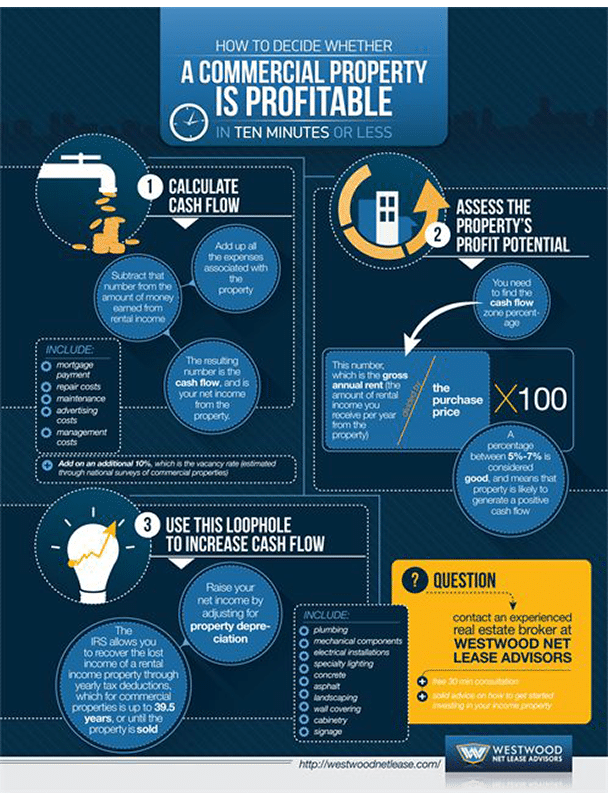
6 Infographics for Industry Pros


Why You Should be Using Real Estate Infographics
If your email is a book and your video content is a movie, infographics are comic books. They’re handy instructions with useful diagrams: easy to follow and remember, and useful enough to save for later.
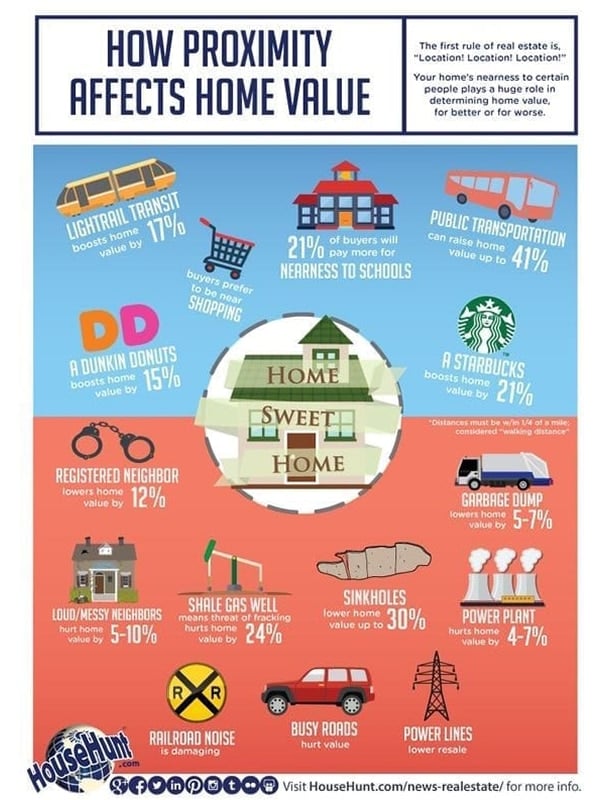
- A colorful, well-executed real estate infographic can explain and simplify many of the complex steps of the homebuying or selling process.
- They grab a reader’s attention and convey lots of information in a compact way.
- Sharing helpful infographics positions you as a subject matter expert (especially if you use graphics customized for your market).
- Infographics provide ways to help build your brand and potentially even go viral.
- They are surprisingly easy to create (we have a great out-of-the-box template) and are easy to post on social media or include in an email drip campaign.
How to Create Real Estate Infographics Quickly & Easily
While these real estate infographics are pretty amazing inspiration, it’s time to create your own.
Here is our quick rundown for creating eye-catching infographics that you can brand as your own in about 20 minutes. You’ll need:
- A good topic. What common questions do you get that would make a compelling infographic? Think about what pain points your buyer and seller leads have and create something to help them. Outline the big ideas you want to share and the background information you think your audience needs to know.
- A free account or subscription―around $10 per month―to an online design service like Canva. A subscription allows you to access more templates, images, fonts, and more. It’s a small price to pay for professional-looking infographics.
In terms of software, I think Canva is the easiest to use and has the best design options, but there are plenty of other companies that offer templates you can customize.
| Provider | Offers | Price |
|---|---|---|
| Canva | Design tools & templates | Free to $120 per year |
| EdrawMax | Design tools & templates specifically for infographics | Free to $99 per year |
| Piktochart | Design tools & templates | Free to $168 per year |
| Infogram | Design tools & templates | Free to $228 per year |
| Venngage | Design tools & templates | Free to $120 per year |
| Snappa | Design tools & templates | Free to $120 per year |
| Typeset | AI created infographics | $228 per year |
| Etsy | Ready-made designs you can customize | $4 to $20 per design package |
Keep images and colors bright and eye-catching. You want your audience to read your infographic, but also save it and send it on to their friends. Remember to keep your text small but still legible for those using smaller monitors and phones.
Once you have a design you’re happy with that is in keeping with your branding (font, colors, etc.), add your logo and contact information to the bottom and export your infographic as a PNG file.
Remember to save a copy in Canva or whatever application you use so you can edit and update it later if your information changes.
Expert Tips for Making Great Infographics
While it’s relatively easy to use the applications you need to make real estate infographics, making an infographic that will go viral and capture the world’s attention isn’t. Here are a few tips to make sure your designs not only look great but actually do their job.
1. Don’t Crowd Too Much Text in a Small Space
One of the biggest mistakes people make when creating infographics is to jam tons of information into too small an area. Unless you think your audience will have magnifying glasses handy, don’t use too much text.
2. Learn the Basics of Color Theory
Some colors just look terrible with other colors, so take the time to learn about complementary colors and the basics of color theory before you start designing.
3. Use Illustrations Instead of Photos
Illustrations generally work better than photos. First, because photos are often rectangular and hard to place, and second, because illustrations are easier to “read” at a glance.
4. Understand Sizing for Social Media Posts
Infographics will shrink to fit your social media feed, which means they may not be legible when downsized, especially on mobile phones. There’s not much you can do about it, so just try to make them look sharp from a distance so people will want to click to make them bigger.
5. Make Sure They Flow
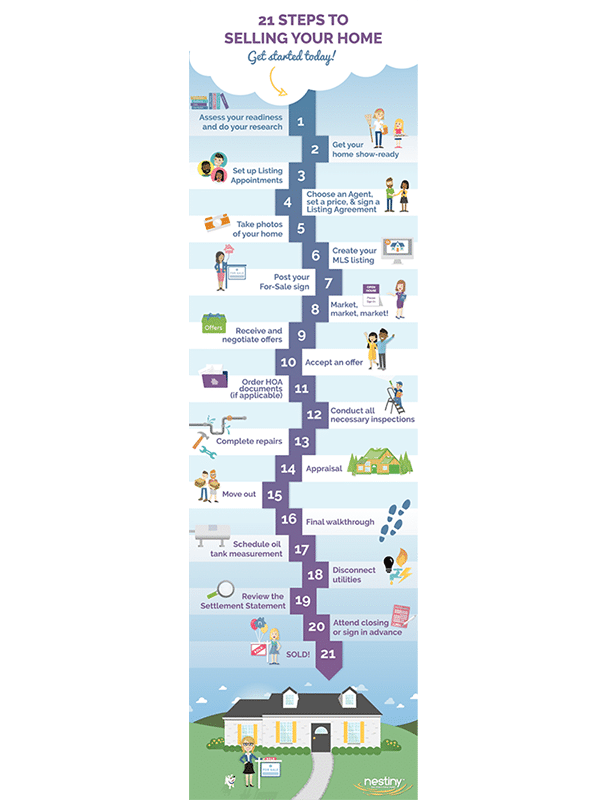
The best real estate infographics explain complex processes in a simple, visual way. Step-by-step instructions, for example, flow from one to the next and work well as infographics.
Infographic Templates for The Close Readers
Get started right now with our customizable Canva templates:
List With Me
Five Keys to Property Investment Success
Mortgage Pre-Approval Checklist
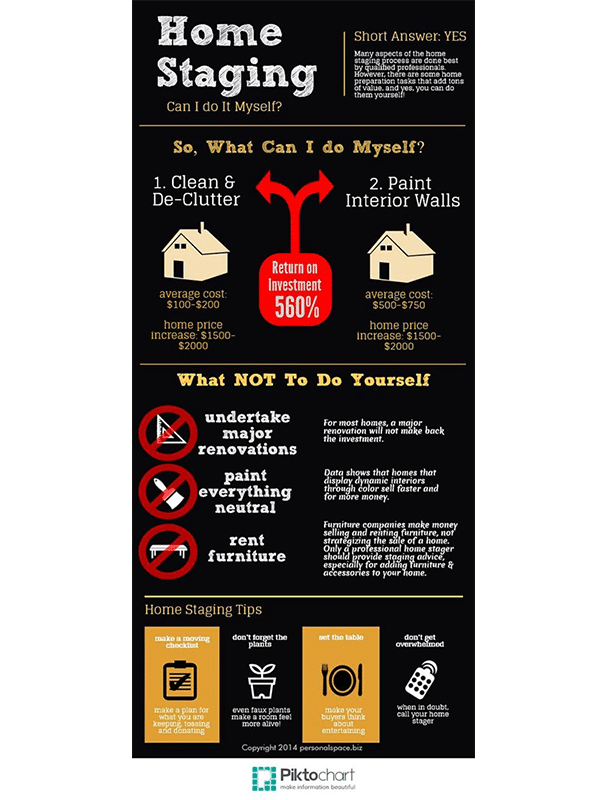
Staging Advice
Information on Your Brokerage
Where to Find More Real Estate Infographics
Maybe you don’t have time to make your own infographics. Here are a few sources that offer impactful real estate infographics to share. Remember, don’t put your logo on them—they are copyrighted content.
Where to Share Your Infographics for Maximum Impact
Ready to share the infographics you’ve created on your own? Here are a few places to share them where you’ll get maximum engagement.
Social Media
Pinterest may not be your primary social network, but it is a massive social media site and “visual discovery engine” with more than 480 million active monthly users (and counting!). It’s also 100% visual, so your infographics will be shared like hotcakes. Even better, Pinterest has a search function, which means other users will find your infographics if you add the right description and title.
Related Article12 Pinterest Real Estate Marketing Ideas to Boost Your Brand
Your infographics will also do well on Facebook and Instagram, but don’t forget LinkedIn, especially for infographics that would speak to your professional network.
Your Email List
Include infographics in your emails, and to increase your open rates, signal to your recipient list what they’re getting if they open your email. For example, if you want to share info about closing costs, a good email subject line would be: 15 Things Every Buyer Needs to Know About Closing Costs (Infographic).
📌 Pro Tip
Send the right infographic to the right segment of your audience. A 65-year-old homeowner will probably not be interested in a first-time homebuyer’s guide.
Your Blog
Using bold, colorful real estate infographics in your posts will greatly increase the chance your audience will read them. Even better, it gives them an excuse to download a useful tool from your website that also has your URL and branding on it. Now, instead of being in the back of their mind, your branding will be in their download folder.
Bringing It All Together
If you have questions about real estate infographics, we have answers. So, go ahead and ask us in the comment section below.