


Before diving into investments, you need to fully understand what cash flow in real estate is all about. Cash flow is the net amount moving in and out of your real estate investment—obviously, an important number to keep track of. It gives a metric for how an investor will know the profitability of a property. Without understanding cash flow, you might have a property that is losing money rather than profiting. Let us take a closer look at what cash flow from real estate is, its importance, how to measure it, drivers, and tips to increase it.
What Is Cash Flow in Real Estate?
Cash flow in property investment simply refers to the difference between the money you take in and what you spend. Positive cash flow means your income exceeds your expenses, and negative cash flow indicates the opposite.
It’s a very simple concept but fundamental to real estate investment practices. A positive cash flow will provide an investor with continuous income and financial stability to reinvest in more properties. Understanding cash flow from real estate will help you make informed buying, holding, and selling decisions regarding property.
Why Do Investors Care About Cash Flow From Real Estate?

Cash flow is the lifeblood of real estate investing. It will dictate whether the property will become a financial liability or an asset. Consistent cash flow can provide for mortgage, maintenance, and other expenses. This padding in your bank account will help safeguard against market downturns or other cost surprises. High cash flow properties will also appreciate over time and increase your overall portfolio. The objective of anyone diving into real estate investing is to get the highest return on their investments.
How to Calculate Cash Flow in Real Estate
Any serious real estate investor must learn to calculate cash flow. The investor will use these equations to understand the property’s profitability and thus be able to make a decent investment decision accordingly. Beyond the cash flow formula, you can use other valuable calculations to enhance the analysis: the CAP rate and the 1% rule. Here are the formulas for the necessary calculations:
Real Estate Cash Flow Formula
This formula helps determine the profitability of a property by calculating the net income after all expenses.
Cash Flow = Total Rental Income − Total Operating Expenses (Operating Expenses + Vacancy Costs + Repair Costs)
Example of positive cash flow: Imagine you own a rental property that generates $3,000 per month in rental income. Your monthly operating expenses, including mortgage payments, property taxes, insurance, maintenance, and management fees, total $2,000.
Using the cash flow formula:
$3,000 − $2,000 = $1,000 (Cash Flow)
In this example, the property provides a positive cash flow of $1,000 monthly, indicating a profitable investment.
Example of negative cash flow: Let’s take the example above with a property generating $3,000 per month in rental income, but now the monthly operating expenses are $4000 because this property has a higher property tax and additional maintenance that must be paid for monthly.
Using the cash flow formula:
$3,000 − $4,000 = -$1,000 (Cash Flow)
This example showcases a negative cash flow that indicates this wouldn’t be a profitable investment.
1% Rule Calculation
The 1% rule is a guideline for a quick and easy way to check that the rental income will more than likely pay off most expenses, indicating some possible positive cash flow. Keep in mind that it is an estimation. Here’s how to calculate it:
- Determine the purchase price: Find out the total cost of the property, including any closing costs and necessary repairs or upgrades.
- Calculate 1% of the purchase price: Multiply the purchase price by 1%.
Purchase Price × 1% (0.01) = Estimated Cash Flow
Example 1% rule calculation: Suppose you are considering buying a property for $200,000. To apply the 1% rule:
1% of Purchase Price = $200,000 × 0.01 = $2,000 (Estimated Cash Flow)
According to the 1% rule, the property should generate at least $2,000 monthly rental income to be considered a good investment. If the expected rental income meets or exceeds this amount, the property will likely provide positive cash flow, making it a potentially sound investment.
Cap Rate
Using the cap rate formula, also known as the capitalization rate, will be beneficial when comparing the potential return on investment among different properties. This calculation is more complicated and involves a few extra steps.
Net Operating Income (NOI) / Purchase Price = Cap Rate
Step 1: Determine net operating income (NOI): Calculate the annual rental income and subtract all operating expenses.
Total Rental Income − Total Operating Expenses = NOI
John owns a rental property that generates $3,000 monthly in rental income, totaling $36,000 annually. His annual operating expenses, which include mortgage payments, property taxes, insurance, and maintenance, amount to $1,000 per month, or $12,000 per year. Calculate his NOI below:
$36,000 (Rental Income) − $12,000 (Operating Expenses) = $24,000 (NOI)
Step 2: Determine Purchase Price: Find out the total purchase price of the property. The total purchase price can include the property cost, closing costs, inspection fees, and necessary repairs or renovations.
$250,000 (Property Price) + $15,000 (Closing Costs) + $34,600 (Repairs/Renovations) + $400 (Inspection Cost) = $300,000 Purchase Price
Step 3: Calculate the Cap Rate using the above formula (NOI / Purchase Price = Cap Rate)
$24,000 (NOI) / $300,000 (Purchase Price) = 0.08 or 8% (Cap Rate)
In this example, the property has a cap rate of 8%. This percentage means the property generates an 8% return on investment based on its net operating income. A higher cap rate generally indicates a more profitable investment.
What Factors Affect Cash Flow?
Several factors may impact cash flow in real estate investing, so it will be important to understand the variables to maintain positive cash flow. Here are the critical elements that influence cash flow most:
- Expenses: Large negative cash flow items include operating expenses like mortgage payments, property taxes, insurance, maintenance, utilities, and property management fees. Other current and nonrecurring expenses that impact your profitability might include major repairs or emergency maintenance.
- Rental income: How much you can charge for rent depends on location, property condition, and market demand. High vacancy or high turnover rates lower rental income, hurting cash flow.
- Rental vacancies: The more vacant a property is, the less rental income will be collected. Effective tenant retention strategies and rigorous screening processes will help minimize vacancies and keep cash flowing.
- Market conditions: Economic conditions, interest rates, and local real estate markets drive rental rates and property values. Shifts in these can negatively or positively affect cash flow.
- Property management: Good property management keeps rent collection, maintenance, and tenant relations in check to provide steady cash flow. Poor management increases vacancies and raises expenses, which will cut profit margins.
By keeping these factors in control, investors can have an inflow of cash to make real estate investing profitable and sustainable.
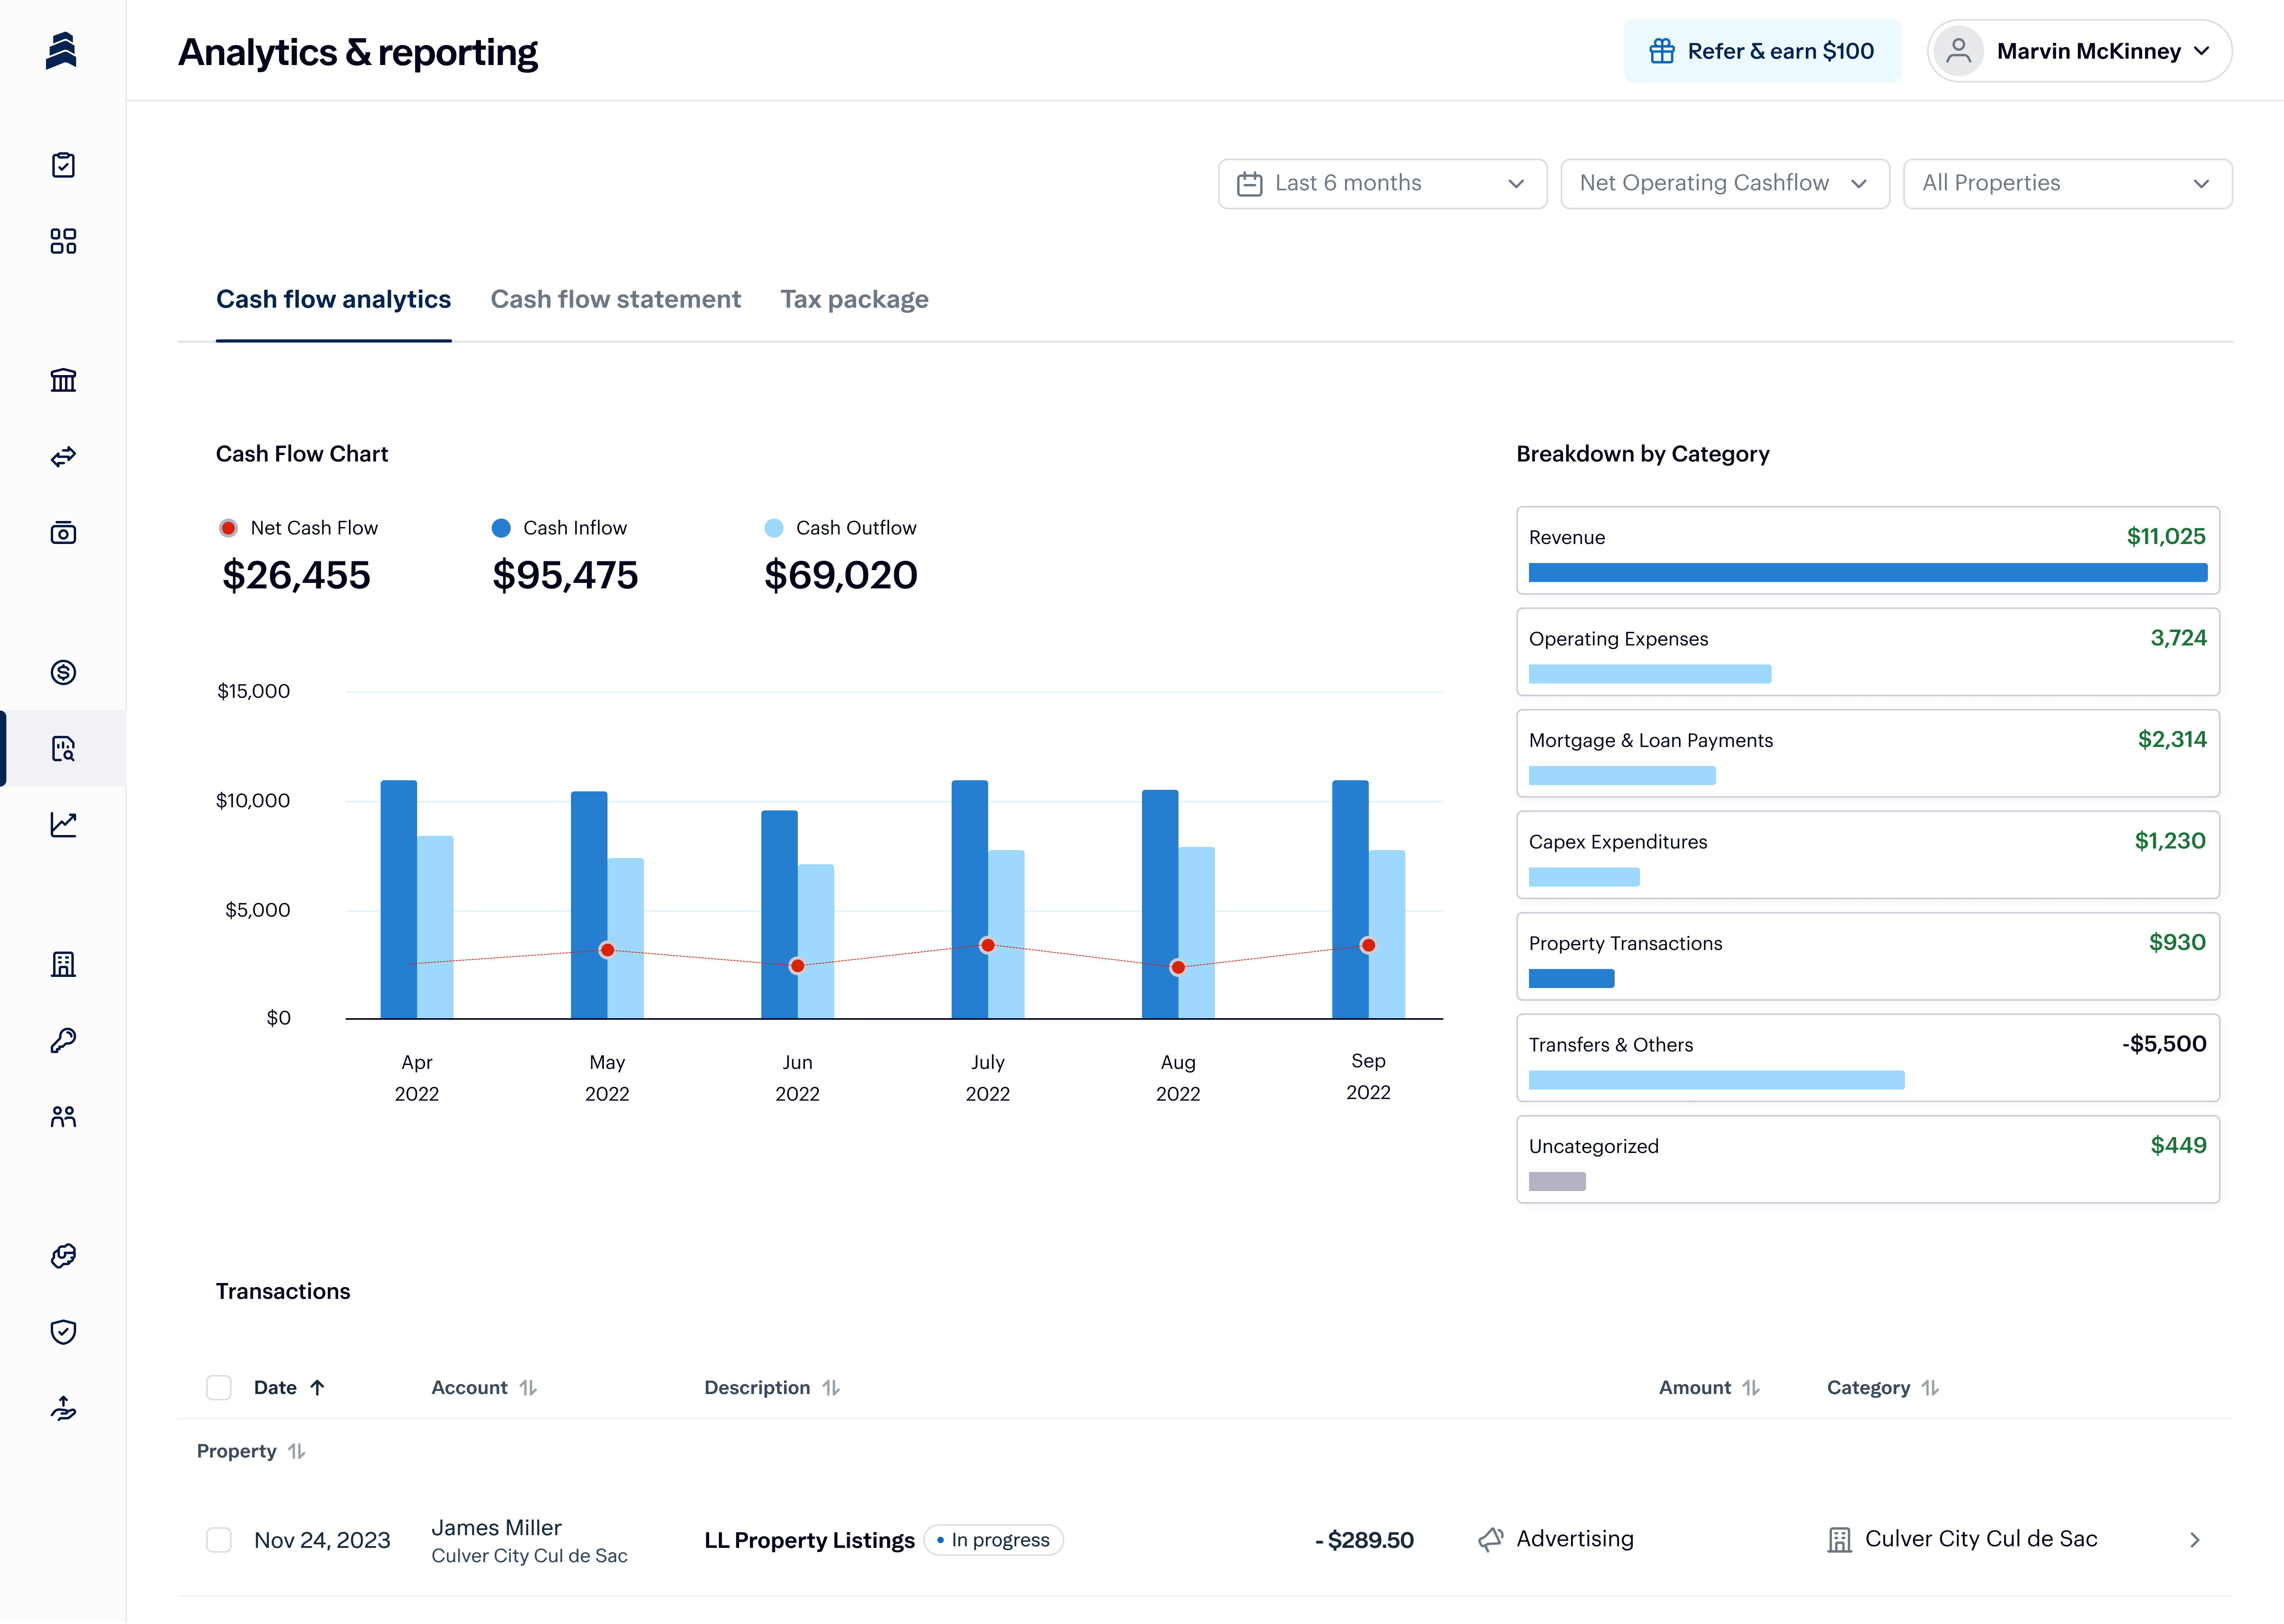
Baselane’s rent collection platform is an excellent avenue to stabilize your rental income. Baselane provides automated payment reminders and seamless online payment options to minimize late or missing payments. This ensures timely reception of your rental income every single time. The platform also provides cash flow analytics and detailed tracking and reporting features that allow landlords to monitor payments and manage finances more efficiently.
Baselane will help property owners maintain consistent income, reduce administrative work, and focus more on growing real estate investments.
Visit BaselaneTips to Increase Cash Flow
Increasing cash flow in real estate requires raising income and reducing expenses. Having a strategic approach to managing your properties as a part of your investing business plan can radically improve profitability. Here are some hands-on tips for maximizing the cash flow of your real estate:
- Increase rental income: Renovate the property, add amenities, consider short-term rentals, and adjust the rent to make it more marketable.
- Reduce vacancies: Enforce tenant screening and incentives for lease renewal, and maintain good relations with tenants.
- Lower operating expenses: Check insurance rates, compare property management fees, maintain the property, and invest in energy-efficient upgrades.
- Optimize financing: Refinance your loan, pay off that high-interest debt, and find alternative ways to finance your purchases.
- Increase efficiency: Implement real estate management software, preventative maintenance, and monitor cash flow regularly.
Frequently Asked Questions (FAQs)
A good cash flow ratio in real estate simply means that a property generates enough income to comfortably pay most of its expenses, leaving room for unexpected costs. Generally, investors look for at least a 1.25 cash flow ratio, meaning that for every dollar of expenses, the property brings in $1.25 in income. This ratio ensures that a property will not only be able to cover its financial obligations but also offer its owners some profit, hence making it a reliable and sustainable investment.
Thorough research and due diligence before buying an investment can easily ensure a property’s cash flow is positive. Analyze the local rental market to get a feel for demand and competitive rental rates. Calculate with precision all possible expenses when investing, including mortgage payments, property taxes, insurance, maintenance, and management fees. Offering property upgrades or adding amenities will justify higher rents for better and more reliable tenants.
Multifamily properties generally create the most cash flow because you have several units in one property, therefore multiple income streams. These typically have lower vacancy rates and spread maintenance costs over many tenants, making them much more profitable overall. Short-term rentals within heavily tourist-demand areas may also provide significant cash flow during peak seasons. When selecting the kind of real estate to invest in, investors should carefully consider local regulations and market conditions to achieve maximum cash flow.
Bringing It All Together
Positive cash flow in real estate is considered the central factor in any successful property investment. After all, the objective of investing is to make money, right? Every investor must take time and perform due diligence before investing in any property. That includes performing market analysis, properly calculating potential income and expenses, and considering improvements needed for the property to gain a higher rental value.
Look for properties with potential for solid cash flow, such as multifamily units or short-term rentals in hot spots. Run those properties professionally, tracking their financial performance closely to adjust your strategy as you go. Keeping an eye on financial performance and tweaking your plan as needed will help keep that cash flowing to ensure your real estate ventures are not just profitable but can also provide you with some enjoyment.