When you’re thinking about buying a home, there’s a lot to consider. You’ll want to look at what the housing market is up to, your finances, and your goals. I’m breaking down home prices, how long homes typically stay on the market, the competition, and when prices tend to go down. Whether you’re a homeowner or a real estate agent wanting to help your clients, it’s important to understand how all these things can impact the best time to buy a house.
Important note: The real estate statistics in this article are based on national surveys and data throughout the US. Some data may differ based on your location throughout the country, impacting the real estate market trends, climate, and the best and worst times to buy a house.
Best Time to Buy a House
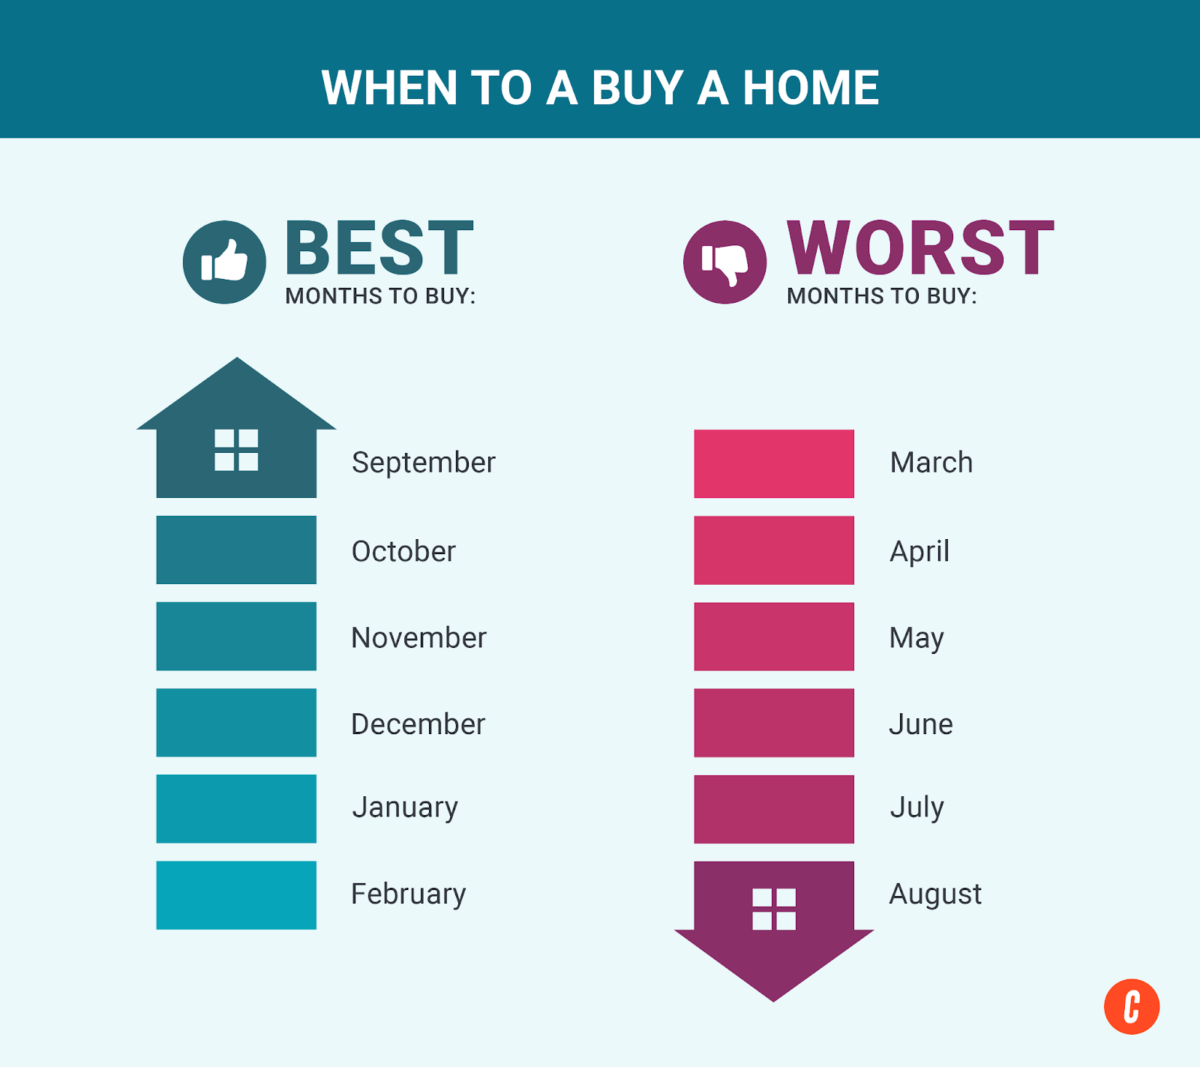
Based on 2023 and 2024 US housing market data,1 the best time to buy real estate is from September to February—during the fall and winter months. I evaluated real estate inventory and activity during this time, seasonal changes in pricing, and the average time listings spent on the market. I also looked into the homebuyer competition that creates a downswing in the real estate market. These factors make an especially advantageous opportunity for buyers.
Key Takeaways:
🔑 Lower home prices
🔑 Higher median days on market
🔑 More price reductions
The Lowest Home Prices Are Typically in January
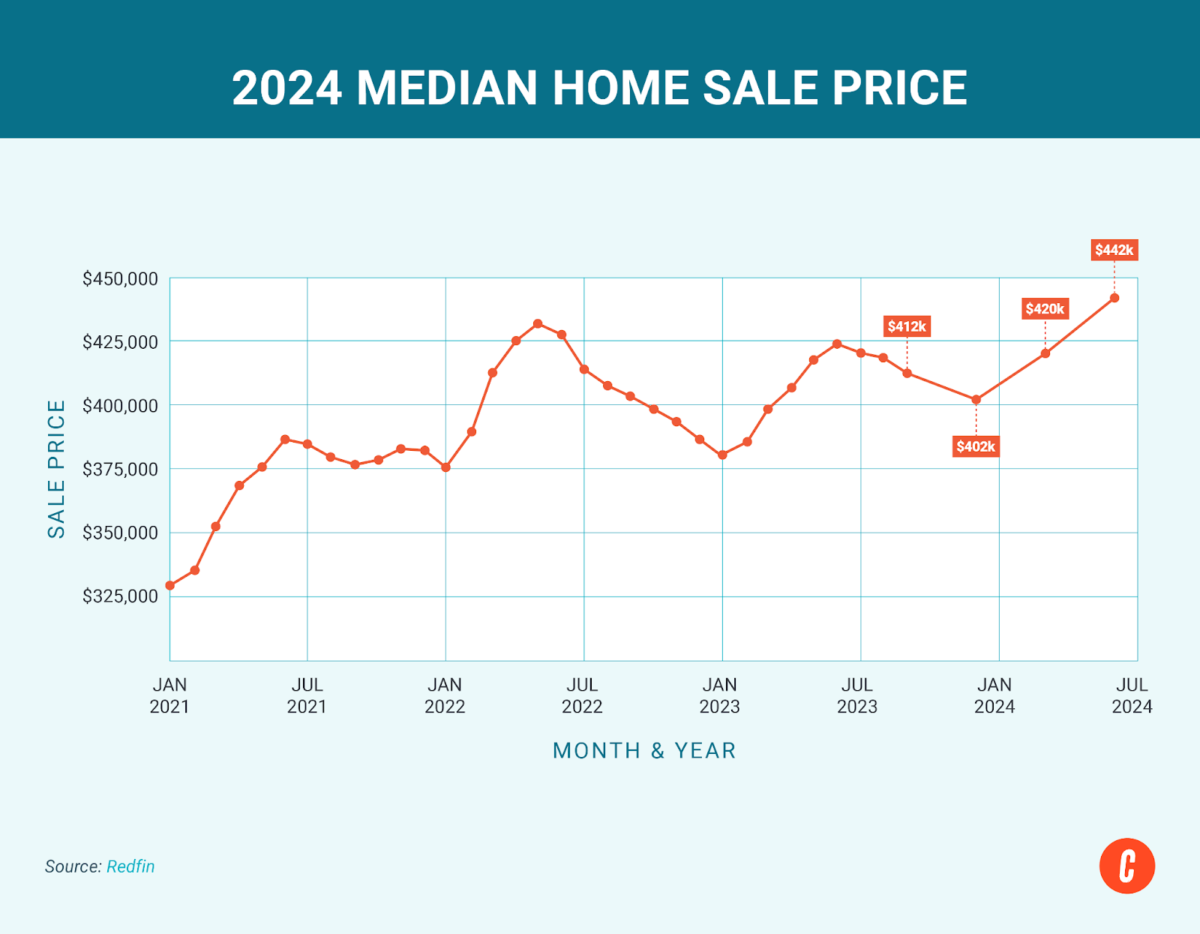
When someone asks the question, “When is the best time to purchase a home?” there are multiple factors to consider. The first would be the average price of homes on the market. While median sales prices are more affordable between September and February, January has the lowest median sale prices overall. For example, the median price of homes in January 2023 was $382,947, which grew to $418,452 in May 2023. In 2024, January’s median sale price was $402,324, which rose to $442,451 in June.1
Higher Median Days on Market in January
The median number of days a home spends on the market rises between November and January, which creates less competition for home buyers. Homes were on the market for 72 and 69 days, respectively, in January 2023 and 2024.2 This is significantly more than the May 2023 median of 43 days or the May 2024 median of 44 days.2
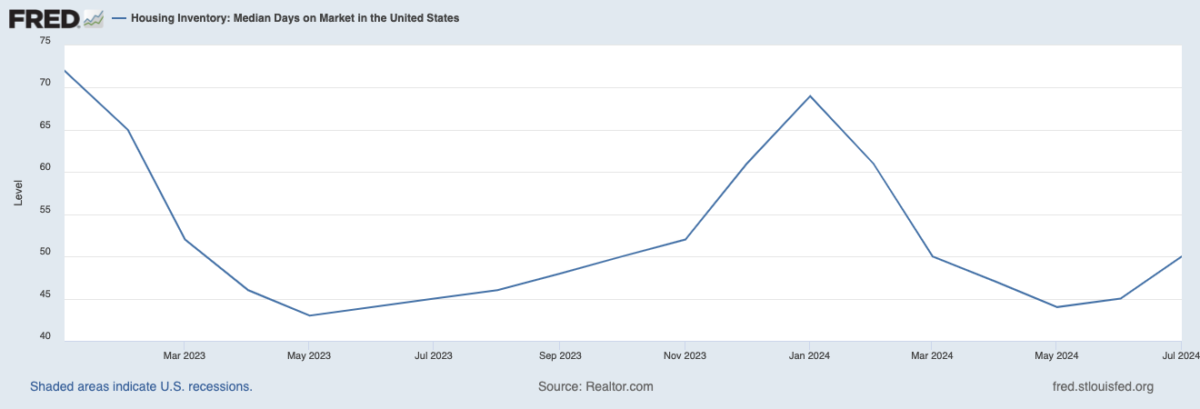
The longer a home sits on the market, the more opportunity buyers have to find and acquire the home they want. A higher number of days on the market also encourages sellers to be more receptive to negotiations on price, closing date, and other terms that can be favorable to buyers. Based on this data, January is the best month to buy a home for the lowest price and the least competition.
More Price Reductions in December
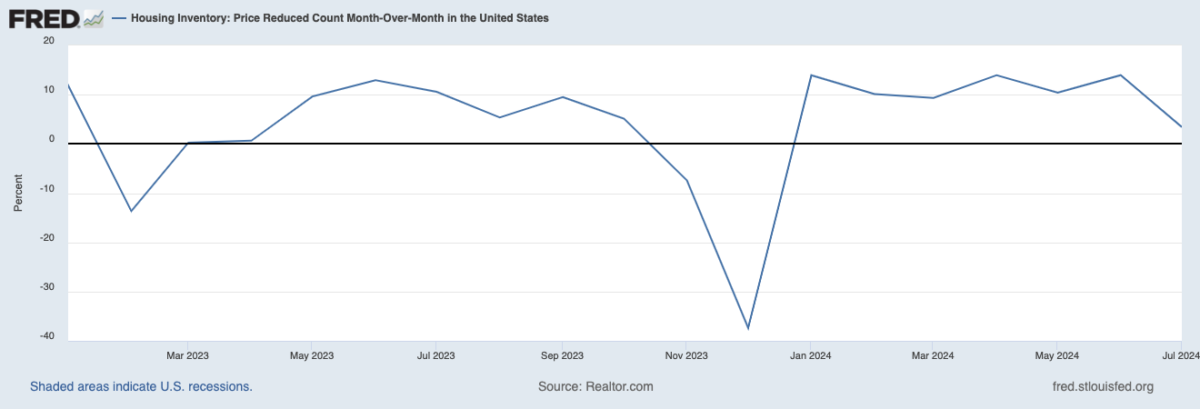
Once a home has been listed on the market for a while with no or very few offers, it’s common for homeowners or real estate agents to reduce the asking price. According to FRED Economic Data,2 December has the highest percentage of price reductions in every housing season. In December 2023, the percentage of price reductions was -37.39%. However, there’s a switch between March and October 2023, when the percentages weren’t even negative.
Worst Time to Buy a House
On the other hand, the worst months to buy a house are from March to August. Housing inventory begins to increase, which attracts a large number of homebuyers. This causes home prices to go up, more homes are sold above the listing price, and the competitive market creates the possibility of bidding wars.
Key Takeaways:
🔑Higher listing prices
🔑More homes sold above listing price
🔑Higher moving frequency
Higher Listing Prices in May
Generally speaking, the spring homebuying season starts in March. The median sale price of homes increased from $412,159 in February to $420,657 in March 2024, showing the increase in homebuying activity and competition. The sale price of homes increased every month between February and June in both 2023 and 2024.1
If you’re evaluating if it is a bad time to buy a house, consider the type of home you’re looking for, your competition, and your finances. This season could be an uphill battle for first-time homebuyers whose purchasing power and credit score may be weaker than experienced homebuyers and real estate investors.
More Homes Sold Above List Price in June
Along with increasing listing prices, more properties are sold over the list price from March to August than at any other time of year. For example, 39.6% of homes sold were above the asking price in June 2023, but only 24.1% in January 2024.1 In June 2024, the percentage increased to 35.1%. Although this is a lower percentage than in 2023, it matches the state of the real estate market and shows that June is not the best month to buy a home for the lowest possible price.
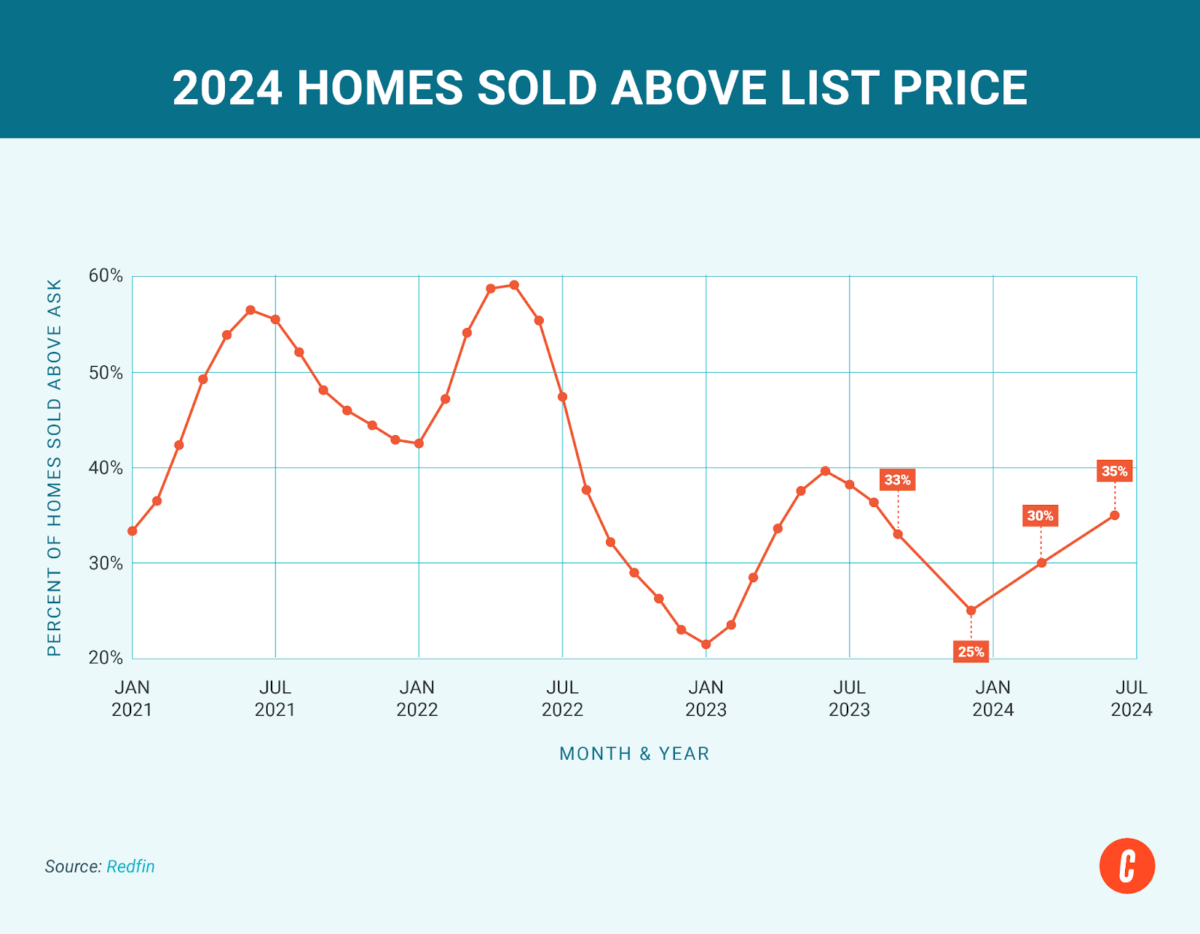
Buyers are most likely to spend significantly more between March and August. The combination of high home prices, high inventory, moving frequency, and homes being sold over the asking price contributes to an active and competitive market. Although these are usually the busiest months for successful real estate agents, it is considerably more challenging for homebuyers to find the right home at the right price during this period.
Higher Moving Frequency in June
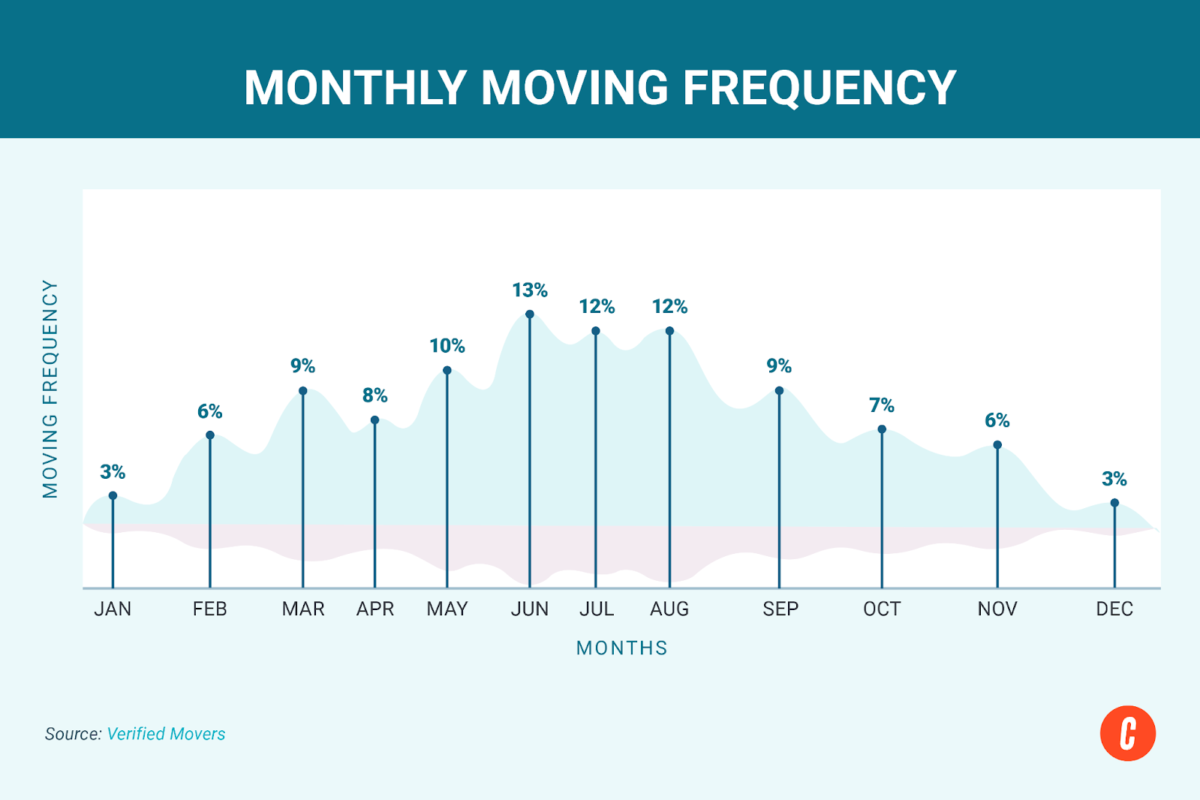
According to research from Moving Labor,4 summer is the most common season for Americans to move. In fact, 80% of all moves happen between April and September. Because of this peak season, booking time with moving companies is more difficult, and costs are higher than in the winter and autumn months. January and December have the lowest moving rates at 3%, while June recorded the highest moving rate at 13%.5
Here is a breakdown of moving frequency by month:
Jan: 3%
Feb: 6%
Mar: 9%
Apr: 8%
May: 10%
Jun: 13%
Jul: 12%
Aug: 12%
Sept: 9%
Oct: 7%
Nov: 6%
Dec: 3%
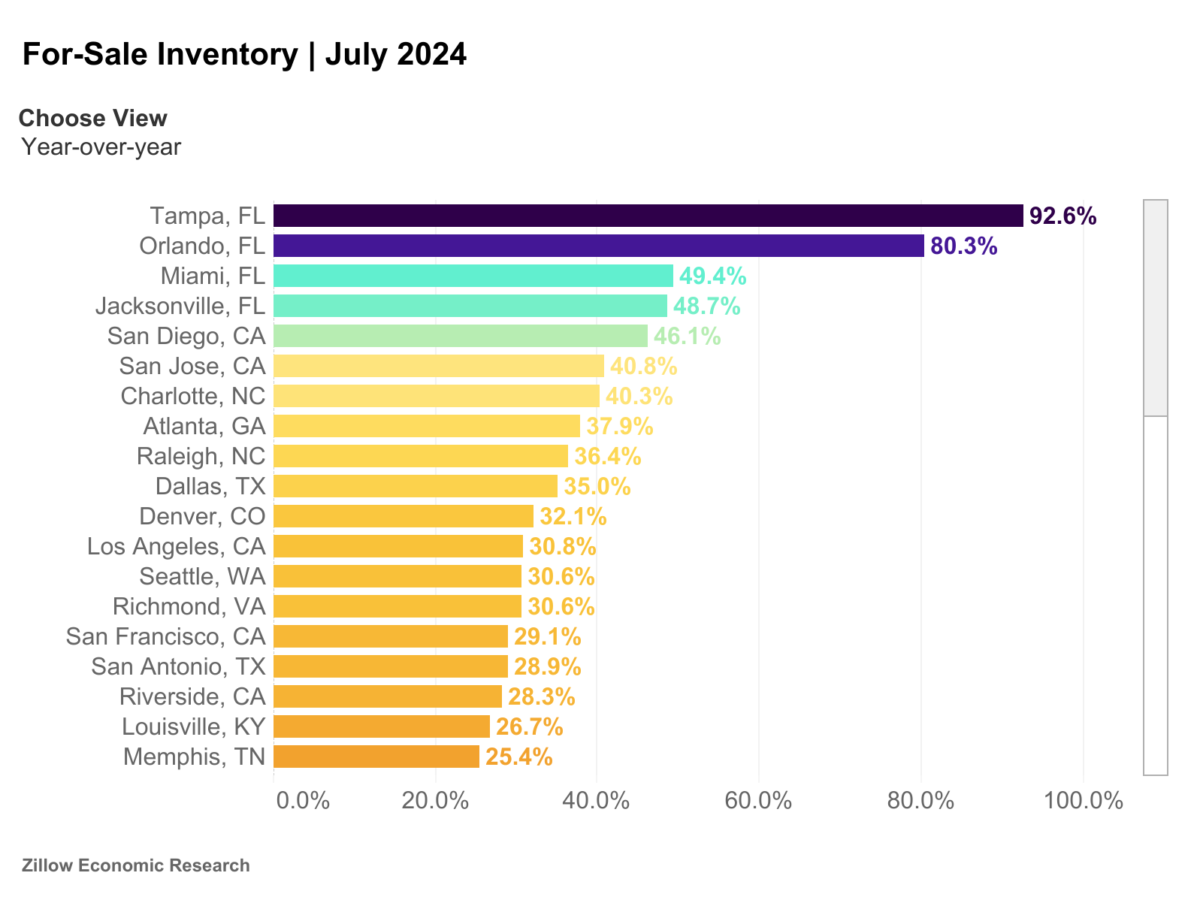
If you aren’t sure how your local market is trending, check out Zillow Research.3 As the most visited real estate listing website in the US, Zillow has a pulse on the latest trends and listings hitting the real estate market. In addition to helping you find affordable properties in your area and the agents who represent them, the platform offers weekly market reports and an interactive home value index tool for visualizing trends.
Housing Market Data by Month
According to the Redfin Housing Market report,1 the 2024 real estate market has seen an increase in prices and market time compared with 2023’s spring market. However, the seasonal trends remained strong, with median sale prices increasing from $402,324 in January 2024 to $442,451 in June 2024.
Take a look at the table below to observe the housing market trends from 2023-2024 to see when houses go on the market and what causes the best and worst times to buy a house:
| Best & Worst Times to Buy a House | Month (2023-2024) | Number of Homes for Sale (in Millions) | Number of Homes Sold | Median Price | Median Days on Market |
|---|---|---|---|---|---|
| Best Months to Buy a House | September 2023 | ||||
| October 2023 | |||||
| November 2023 | |||||
| December 2023 | |||||
| Best Months to Buy a House | January 2024 | ||||
| February 2024 | |||||
| Worst Months to Buy a House | March 2024 | ||||
| April 2024 | |||||
| May 2024 | |||||
| June 2024 | |||||
| Source: Redfin | |||||
Other Key Housing Market Indicators for Buyers
To gain a complete understanding of the current real estate market and determine the best time to buy a house for yourself, there are additional factors you should be familiar with. Aside from seasonality, the following indicators will dictate your buying power and provide insight into whether you should move forward with a purchase:
- Local housing affordability
- Interest rates
- Median days on the market
- Housing inventory
- Time of year
- Market type
- Rental market trends
To read more about these indicators and see how they affected the 2024 market, check out our article, 19 Real Estate Charts: Breaking Down the 2024 Housing Market.
Frequently Asked Questions (FAQs)
When do most houses go on the market?
Market trends vary based on several factors; however, the highest number of homes are listed for sale between March and September. This makes the period between November and February an excellent opportunity for buyers to pounce on a home that has been on the market longer than anticipated and possibly experience less competition when submitting an offer.
What is the best age to buy a house?
There is no set age to buy a house. This is a personal decision based on various factors, including your finances, housing expenses, and job stability. Of course, knowing the trends in the current real estate market is important; however, that is not always the sole factor as to whether or not people want to—or even can—make a home purchase.
Is 2024 a Good Time to Buy a House?
If you’re considering a property purchase, knowing the seasonal real estate trends is the first step to making a wise financial decision. In addition, you should also be aware of your personal finances and goals, the overall state of the US real estate market, the market growth, and how it’s expected to change in the near future.
Home values have grown significantly in the last few years, and federal interest rates, ranging from 6% to 7.5% throughout 2023 and 2024, are higher than they’ve been in the last 20 years. However, even though interest rates and home values can be intimidating for buyers, the continual growth of both figures shows that buying a house can still be a good decision in 2024. If you choose to wait for the market to slow down, you may end up with even higher interest rates and home prices.
Bottom Line
So now that we’ve broken down the data, it’s clear to see that the best time to buy a home is between September and February. On the flip side, if you’re forced to buy during the spring and summer seasons, brace yourself for a more competitive market. But always keep in mind that other factors like mortgage rates can also play a role in your homebuying journey, no matter what time of year.
Sources
2FRED


Add comment